
1. Report Types
Under this title, various report categories are gathered where you can analyze the operational data in your Supsis AI system from different perspectives. Through this section, you can view in detail the overall distribution of customer interactions, the performance of communication channels, the daily working metrics of your customer representatives, and customer satisfaction rates. You can easily access the specific data analyses your business needs through the rich variety of reports offered in this area and determine your strategies accordingly.
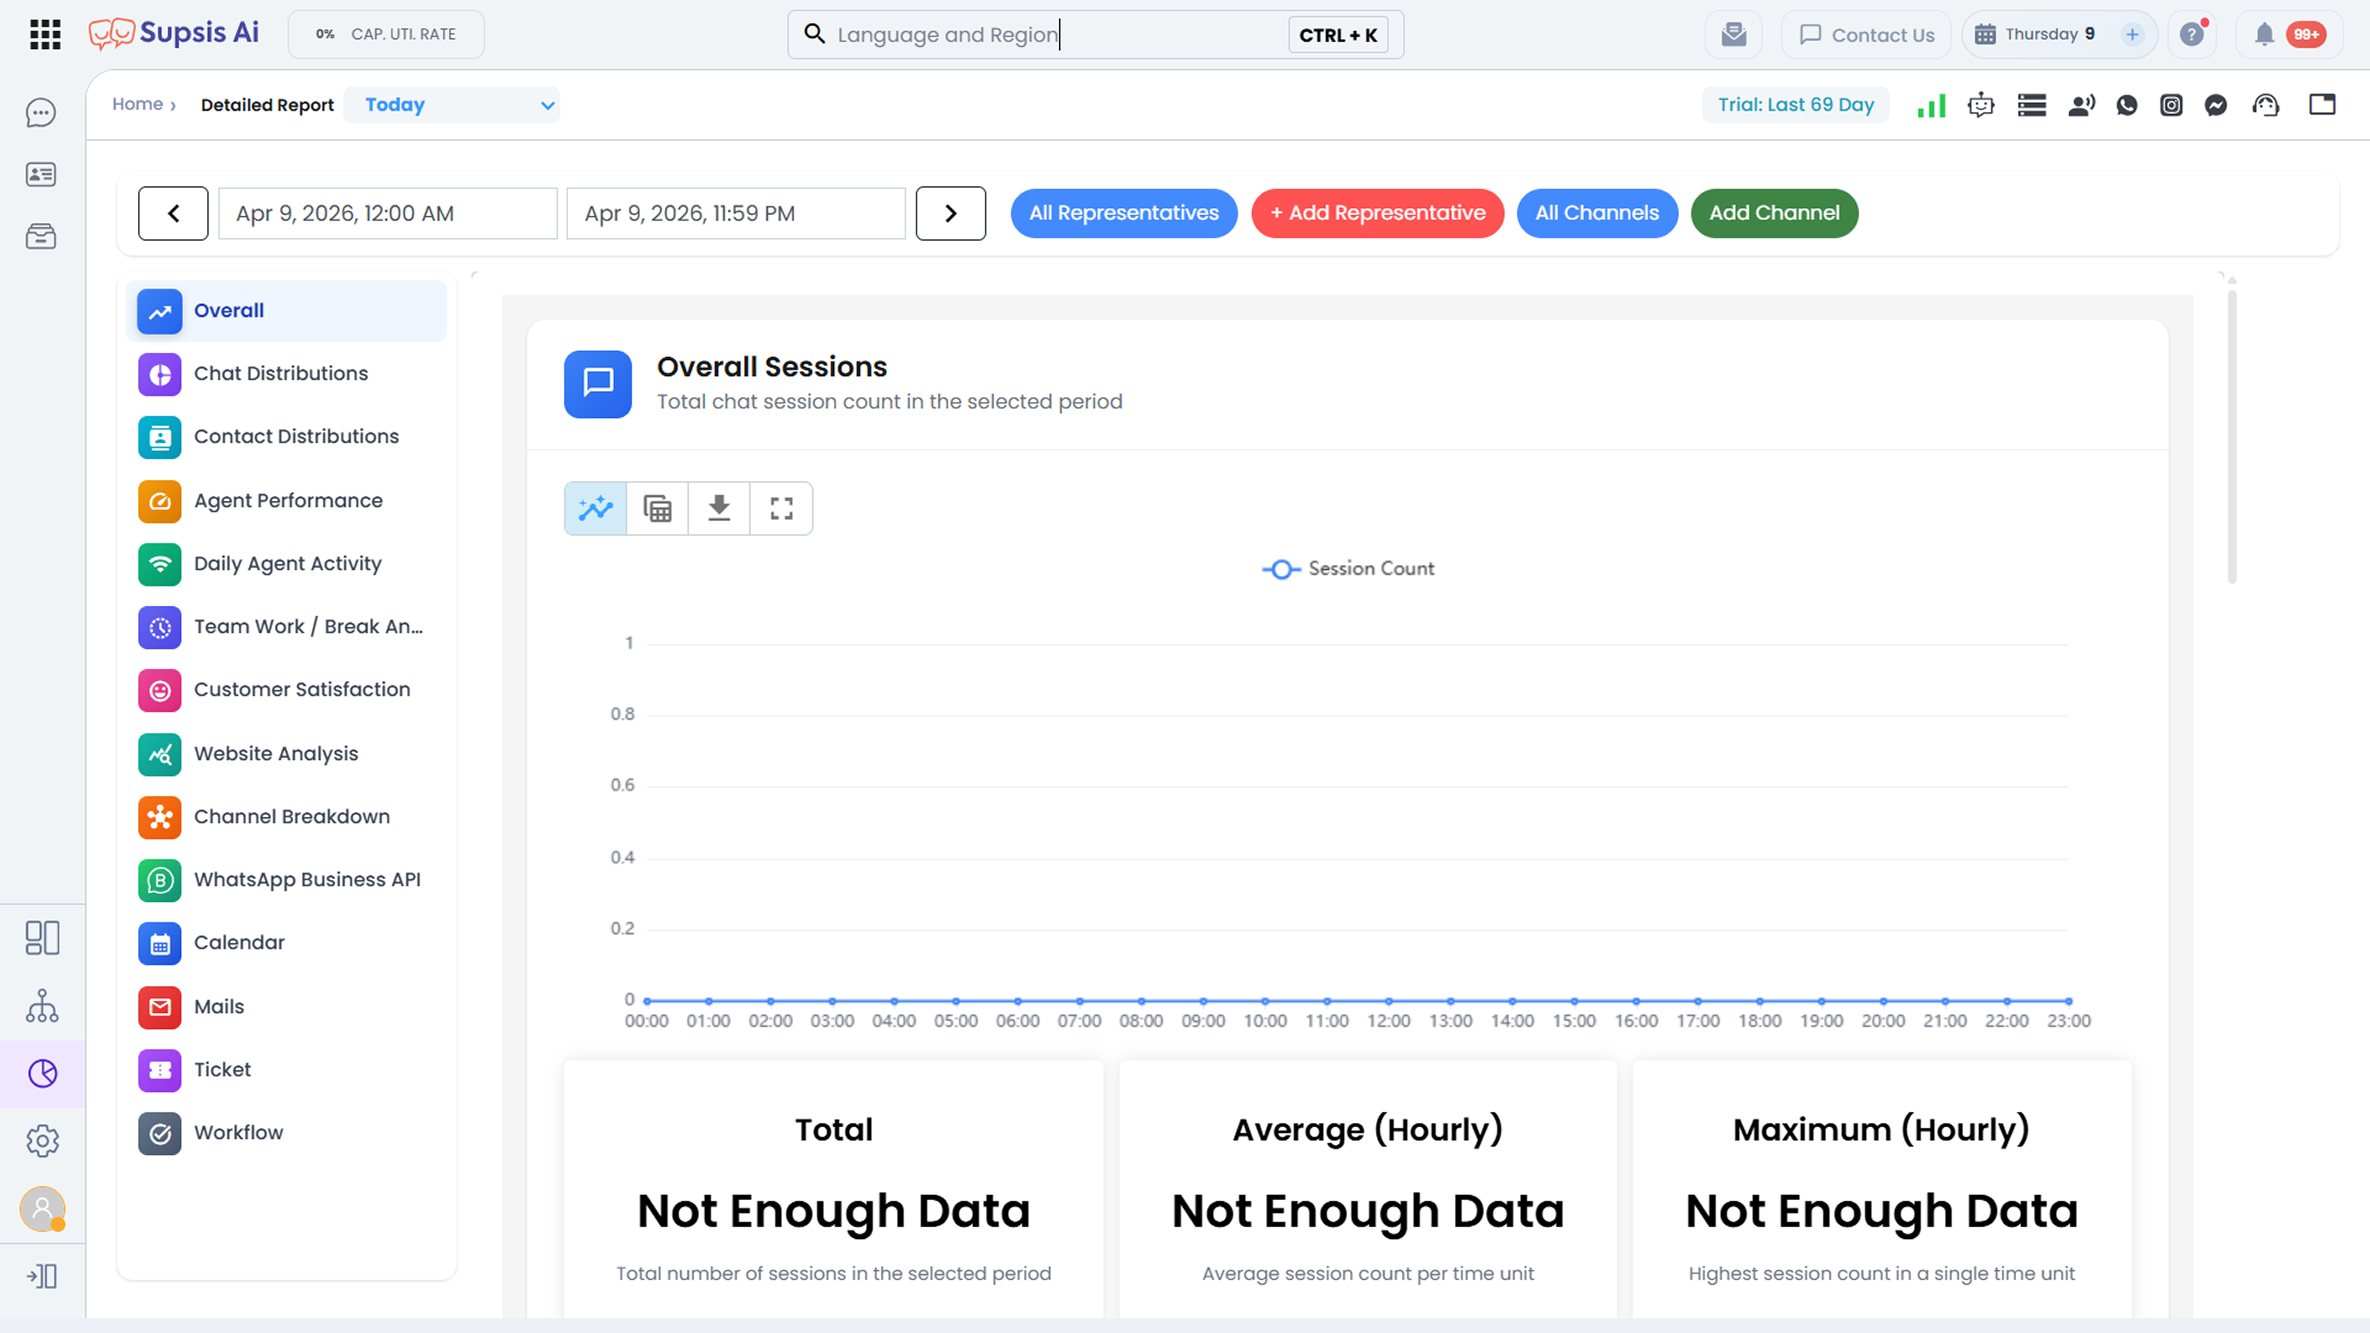
1.a – General Reports
This section, which allows you to analyze the overall chat traffic and duration metrics in the system at a basic level, consists of two main components.
a. Sessions Overview
Represents the total number of chat sessions within the selected period.
b. Overall Session Duration
Shows the average length of chat sessions and the total time spent, providing insight into operational performance.
1.b – Chat Distribution
This report type, which details from which sources chat sessions originate and by whom they are answered, provides four sub-metrics.
a. Chat Counts by Representatives
Shows the number of chat sessions handled by each customer representative.
b. Chat Counts by Platform
Lists from which platform source the chats were initiated.
c. Chat Counts by Response
Reflects proportionally how many incoming chats were successfully answered and how many remained unanswered and were missed.
d. Chat Counts by Responder
Presents the overall distribution of whether sessions were handled by the chatbot in the system or by a live representative.
1.c – Person Distribution
It is a comprehensive reporting area that analyzes the demographic, behavioral, and marketing-oriented distributions of users interacting with your system.
a. Person Distribution by Time
Shows the intensity of user interactions in specific time intervals.
b. Person Distribution by Channel
Lists the distribution of the number of people according to the communication channels used.
c. Person Distribution by Tags
Reflects the usage distribution of categorical tags assigned to users within the system.
d. Person Distribution by Platform
Indicates the device or platform sources from which visitors access the system.
e. Person Distribution by Owner
Analyzes the distribution of people according to the representative they are assigned to within the system.
f. Person Distribution by Language
Separates users according to the languages they prefer or that are defined in the system.
g. Person Distribution by Ads
Shows the distribution of people based on the advertisements they came from
h. Person Distribution by Ad Name
Provides analysis of the specific ad names from which users originate.
i. Person Distribution by Ad Set Name
Details from which ad sets the chat traffic originates
j. Person Distribution by Campaign Name
Provides a comparative view of user acquisition from marketing campaigns.
k. Person Distribution by Selectable Profile Fields
Reflects the most detailed distribution categorized according to custom data fields (profile fields) in person profiles.
1.d – Representative Performance
This section, which measures the operational speed and efficiency of your customer service team, includes two main analyses.
a. Chat Resolution Time by Representatives
Shows how long it takes on average for representatives to resolve a chat or customer issue.
b. First Response Time of Representatives
Measures speed on a representative basis by analyzing the average time taken to provide the first response to the customer.
1.e – Daily Representative Activities
Shows the activities of the team during the day.
a. Daily Representative Activities
It is a general reporting screen that presents a summary of all operational activities of your teams during the day (login, logout, and total number of actions).
1.f – Team Work/Break Analysis
This section, which reports your team's working states and time management during working hours, consists of two parts.
a. Representative Work Time Calendar
Shows in detail how long representatives spend in status states such as online, busy, be right back, or offline.
b. Number of Breaks of Representatives
Reflects the frequency and time distribution of breaks taken by Supsis AI users during the day.
1.g – Customer Satisfaction
This reporting area, which analyzes the user experience directly from the perspective of your customers, consists of three components.
a. Customer Ratings
Shows the distribution of customer satisfaction scores given by customers via the chat bubble at the end of the conversation.
b. Representative Waiting Time Graph
Reports how long customers wait on average to be connected to a representative.
c. Comment Analysis
Helps you measure service quality by listing the best and worst feedback comments left by customers.
1.h – Website Analysis
This section, which contains the visitor statistics of your website, includes two main metrics.
a. Website Traffic
Shows the visitor intensity and change to your website over time.
b. Website Traffic by Country
Details the distribution of your visitors according to their geographical locations.
1.i – Channel Distribution
This title, which allows you to analyze chat traffic coming from different integration channels independently, includes the breakdown of all communication channels.
a. Chat Distribution by WhatsApp Channels
Presents the statistics of chats initiated via WhatsApp.
b. Chat Distribution by Instagram Channels
Provides the distribution of Instagram messages.
c. Chat Distribution by Messenger Channels
Shows the distribution of chats coming from Facebook Messenger.
d. Chat Distribution by Trendyol Channels
Reports customer communications coming from your Trendyol marketplace store.
e. Chat Distribution by Meta Leads Channels
Shows the chat distribution of requests coming from Meta forms.
f. Chat Distribution by Telegram Channels
Shows the distribution of chats coming from Telegram.
g. Chat Distribution by Linkedin Channels
You can examine in detail the communications obtained from the LinkedIn integration.
1.j – WhatsApp Business API
This section, which presents technical and financial metrics regarding your WhatsApp API usage, includes two report types.
a. Message Traffic
Shows the intensity distribution and trend of incoming and outgoing WhatsApp messages over time.
b. Wallet Status
Facilitates financial management by reporting your WhatsApp Business API balance usage and current wallet status.
1.k – Calendar
This reporting section, which measures your time and event management, includes two types of analysis.
a. Calendar Events
Shows the numerical status of created general calendar events according to time series.
b. Reservation Events
Provides time-series-based analysis of the number of reservations created by customers.
1.l – Emails
In this section reflecting your email communication traffic, two metrics can be tracked.
a. Incoming Emails
Shows the distribution of the number of emails received by your system within a time period.
b. Sent Emails
Shows the distribution of the number of emails sent externally over time.
1.m – Ticket
This section, which analyzes the intensity and resolution processes of your support request operations, provides three main evaluations.
a. Ticket Counts by Representatives
Shows how many support requests are assigned to each customer representative.
b. Chat Counts by Response Status
Reflects an overall ratio distribution according to whether requests are answered or left unanswered.
c. Chat Counts by Response Status
Shows the change in the number of requests over time and the overall trend.
1.n – Workflow
This area, which reports the operational balance in your project and task management processes, includes four subheadings.
a. Most Assigned
Lists the representative with the highest number of assigned tasks in the relevant workflow.
b. Least Assigned
Helps balance workload by showing the representative with the least number of tasks in the workflow.
c. Total Task Count
Indicates the total number of all tasks created within the selected workflow. Finally
d. Task Count by Stage
Reports the numerical distribution of tasks according to the stages within the workflow.