
Through this menu, you can list your automations, analyze performance data, and manage the automation table comprehensively.
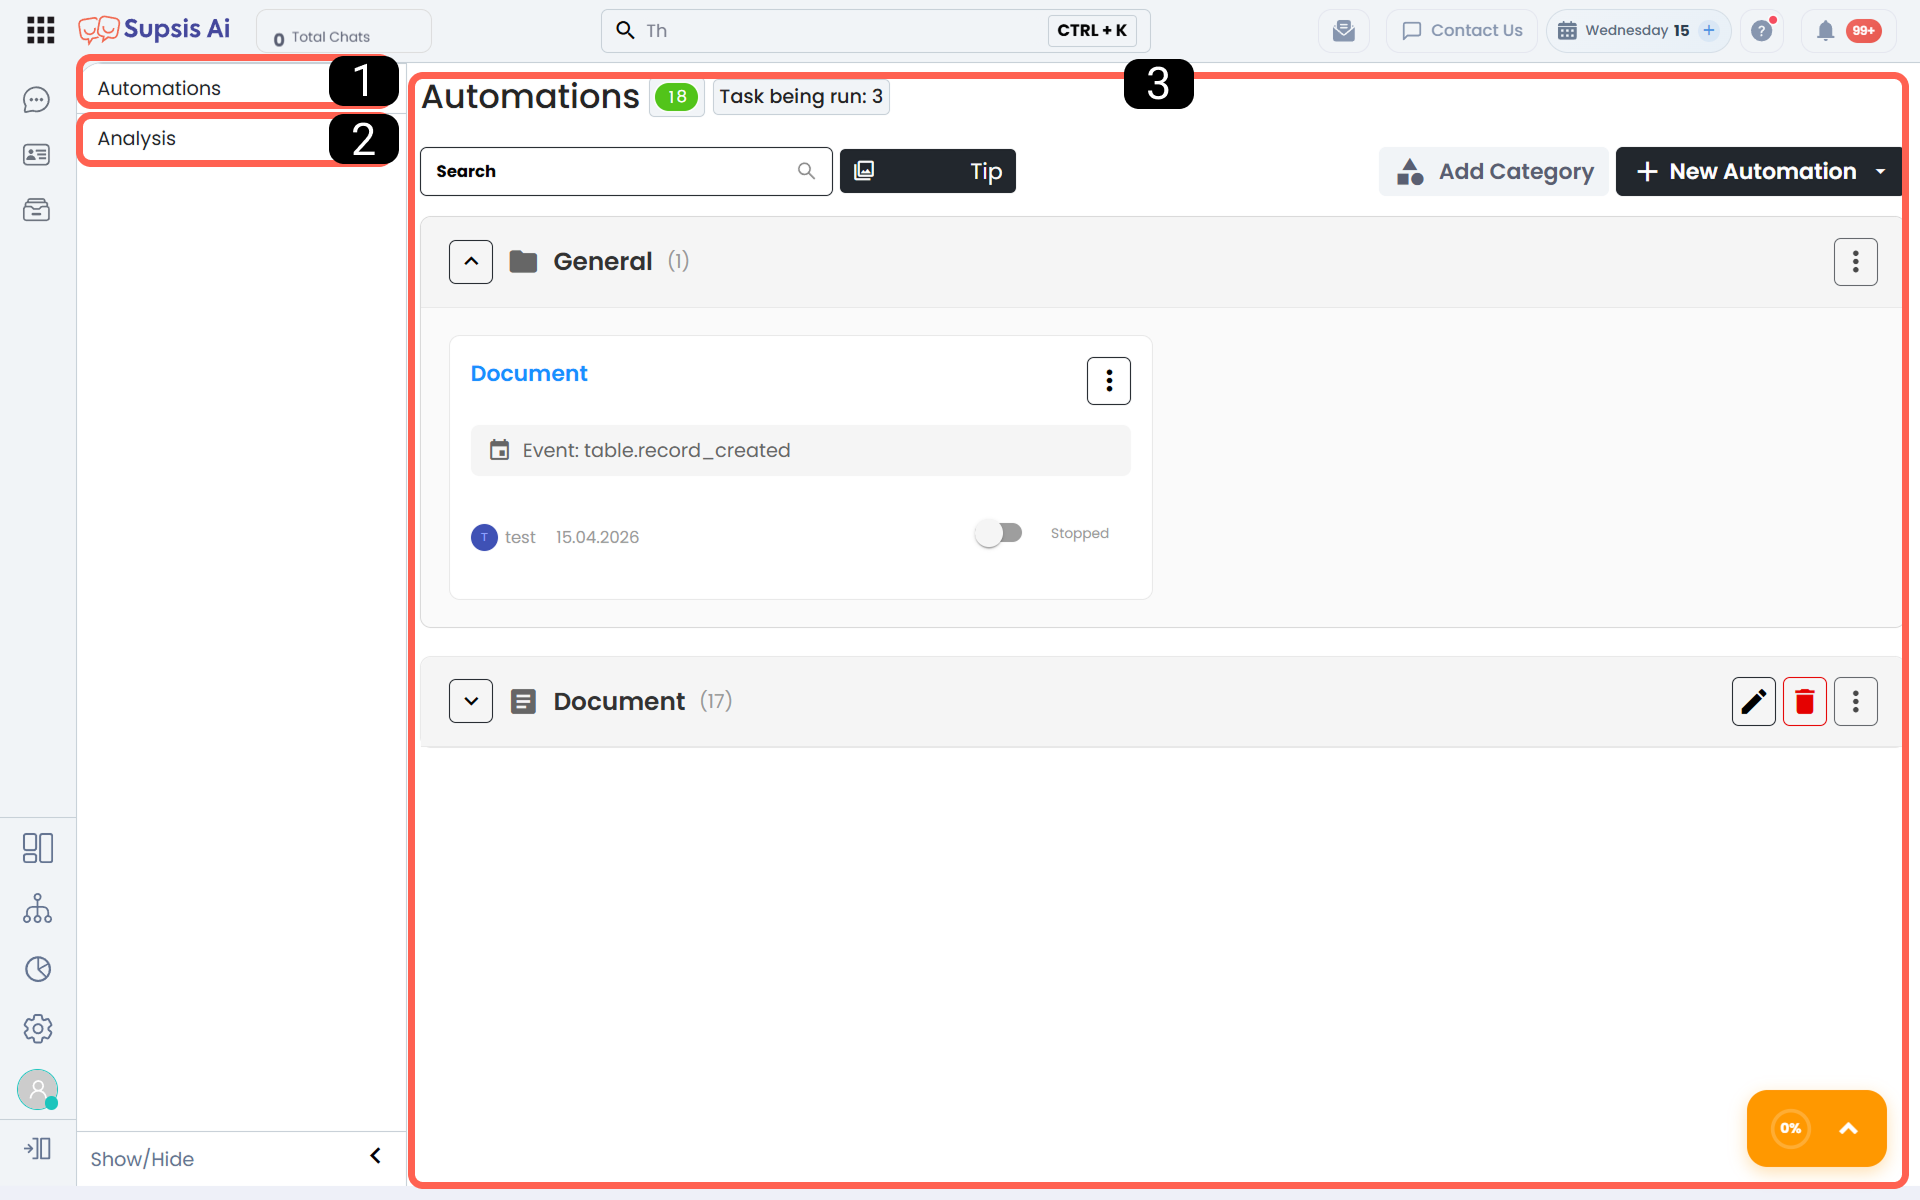
| No | Menü |
|---|---|
| 1 | Automations |
| 2 | Analysis (Statistics) |
| 3 | Automation Table |
1. Automations
It is the main workspace where you create your automation scenarios in your system, manage your existing flows, and filter them by their types. You can view all structures that automate your business processes through the tabs under this menu.
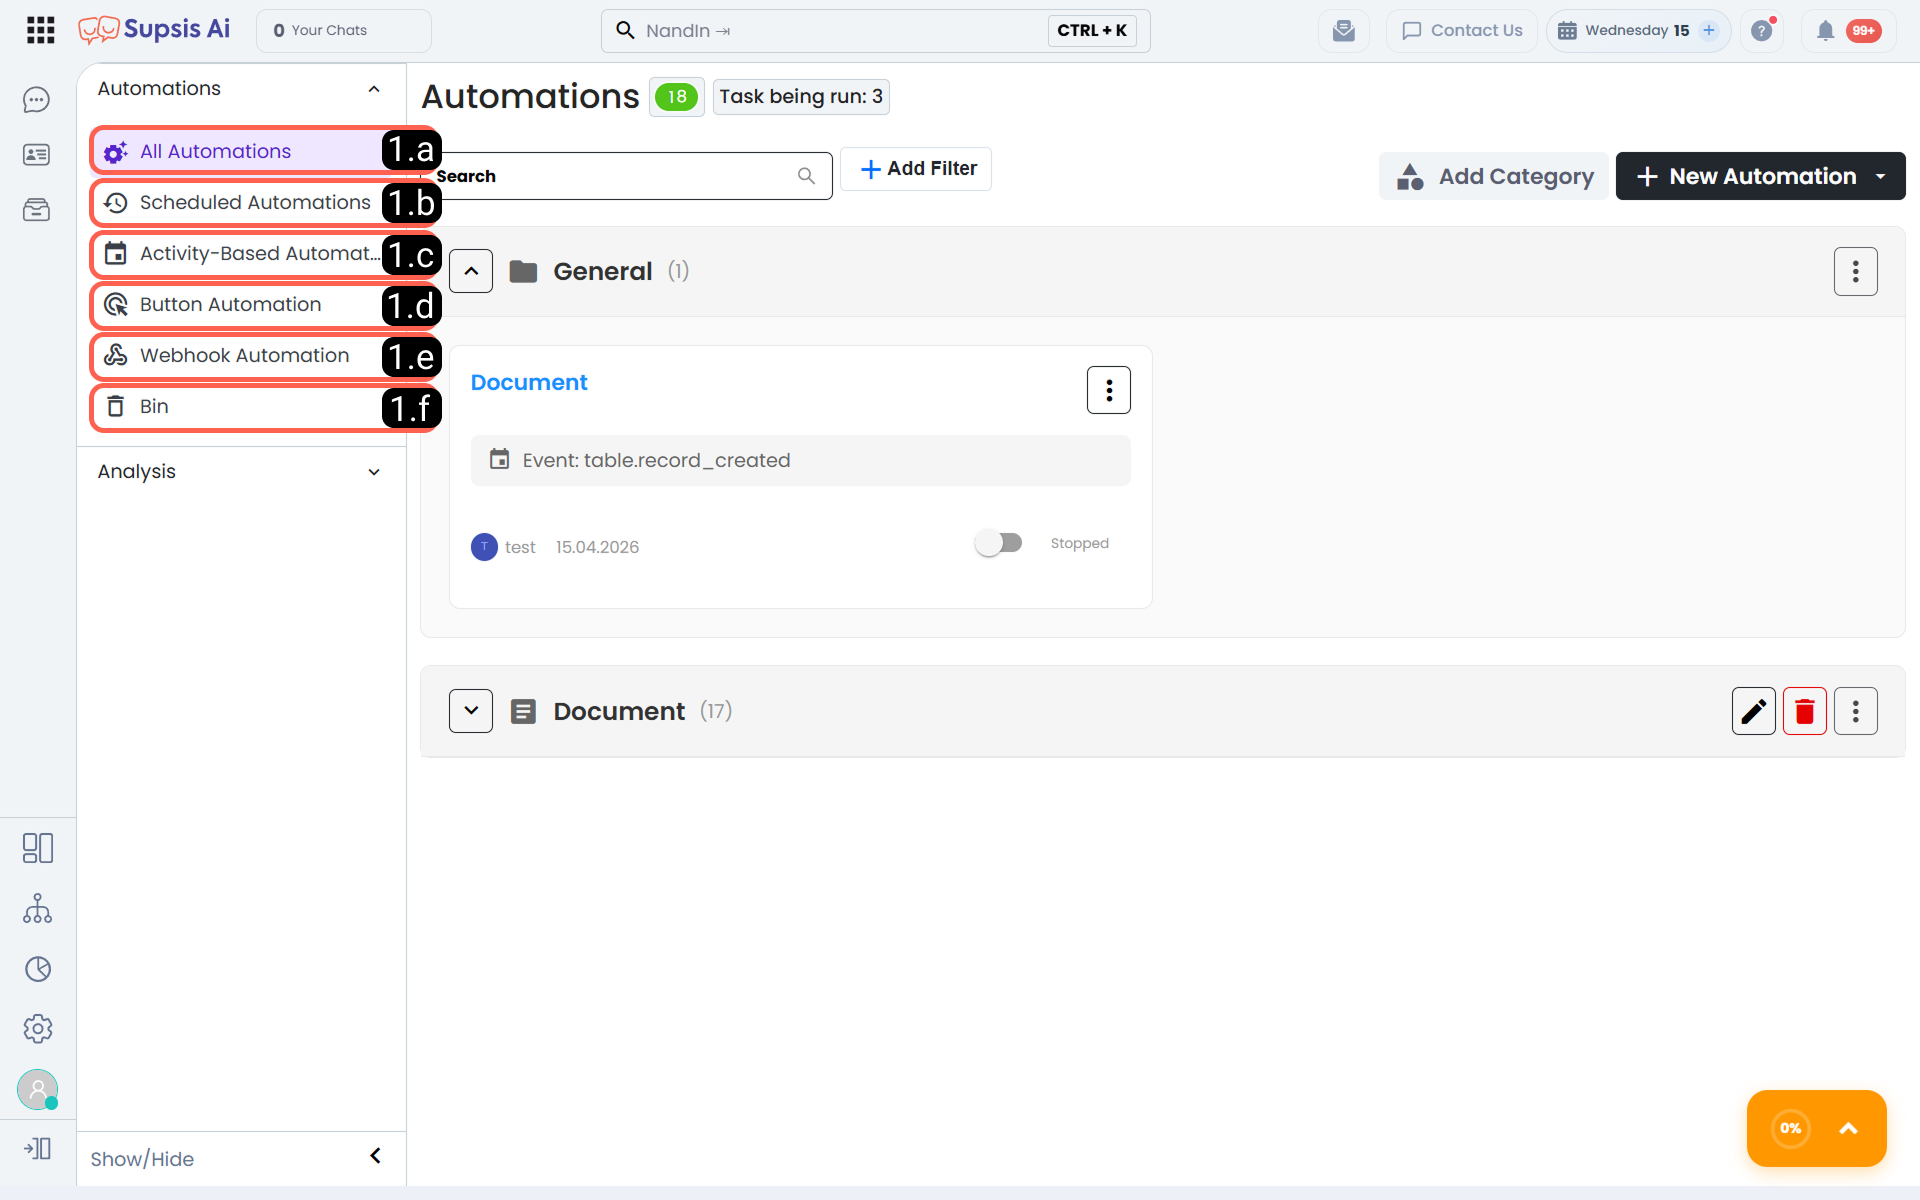
| No | Menü |
|---|---|
| 1.a | All Automations |
| 1.b | Scheduled Automations |
| 1.c | Event-Based Automations |
| 1.d | Button Automations |
| 1.e | Webhook Automations |
| 1.f | Trash |
1.a – All Automations
You can access all contents of all automation types (Scheduled, Event-Based, Webhook, Button) installed in the system collectively through this menu and view all your scenarios in a single list.
1.b – Scheduled Automations (Scheduler)
Scheduled automations run automatically according to the periods, days, and specific time intervals you define within the automation content. It ensures that recurring tasks are performed regularly, autonomously, and in accordance with rules once configured in the diagram.
Scheduled Automation Data & Execution Model
This automation type does not possess predefined triggering data (event payload) when initialized. If data-based processing is required, relevant information must be fetched into the flow using automation blocks (e.g., Database Query, Webhook, AI Agent, etc.) (see Automation Blocks).
Accessing and Configuring the Scheduler Plan
When creating or modifying a scheduled automation, the Scheduler panel in the designer is used to configure trigger rules.
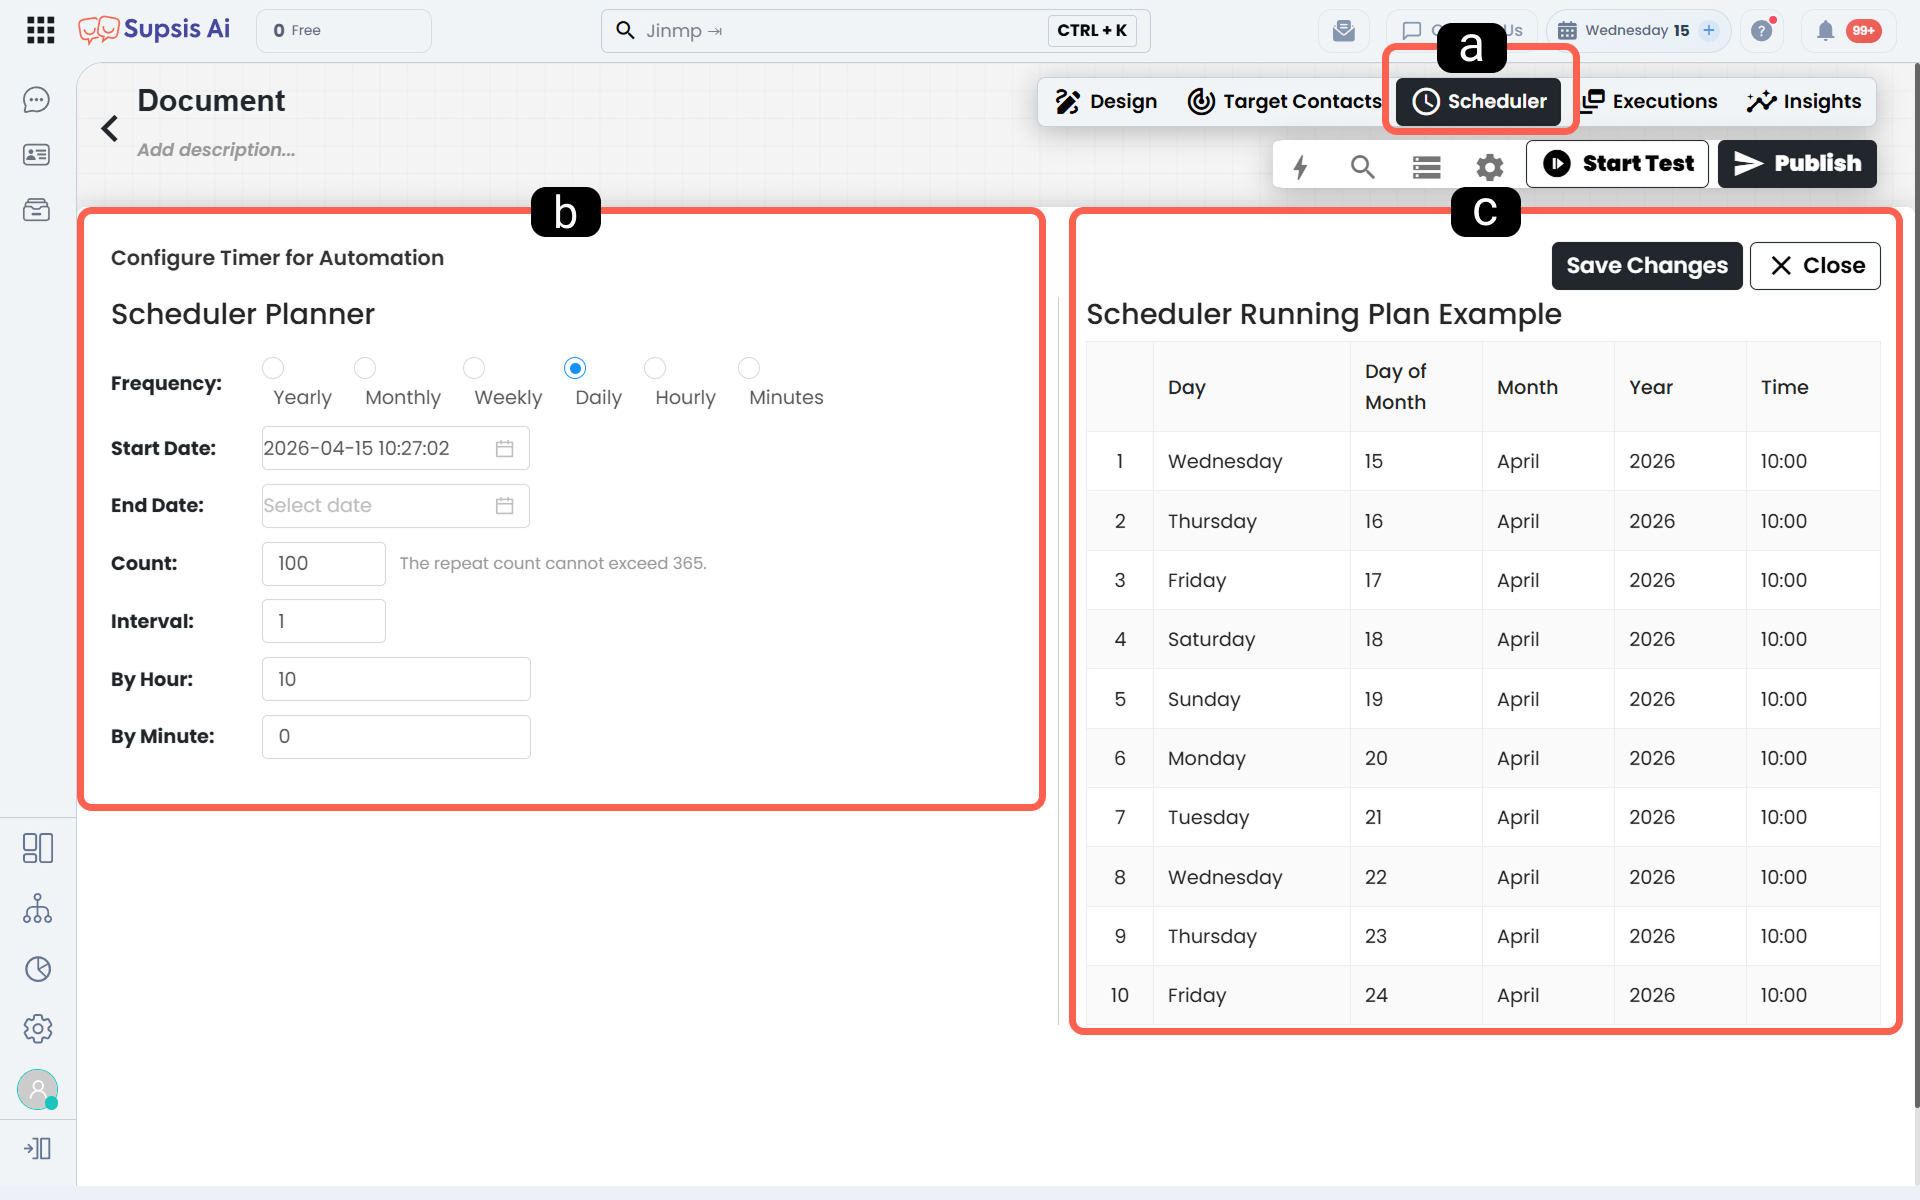
1- Scheduler Menu
The scheduler menu is exclusively available for scheduled automation types. It can be accessed via the Scheduler tab in the top navigation bar of the designer.
2- Scheduler Configuration Parameters
The fields available in the scheduler configuration panel are detailed below:
| Field Name | Description | Limit / Default |
|---|---|---|
| Frequency | Defines the recurring schedule (Minutes, Hourly, Daily, Weekly, Monthly, etc.). | User-defined |
| Start Date | The exact date and time the automation begins its scheduled execution. | Mandatory |
| End Date | The optional expiration date/time when the schedule terminates. | Optional |
| Count (Repetition Count) | Sets the total maximum number of runs for the automation plan. | Up to 1000 runs |
| Interval | Multiplier for the selected frequency (e.g., Frequency "Daily" with Interval "2" runs every 2 days). | Positive integer |
| By Hour / Minute | Specific hour and minute when triggers should execute on scheduled days. | Hour (0-23), Minute (0-59) |
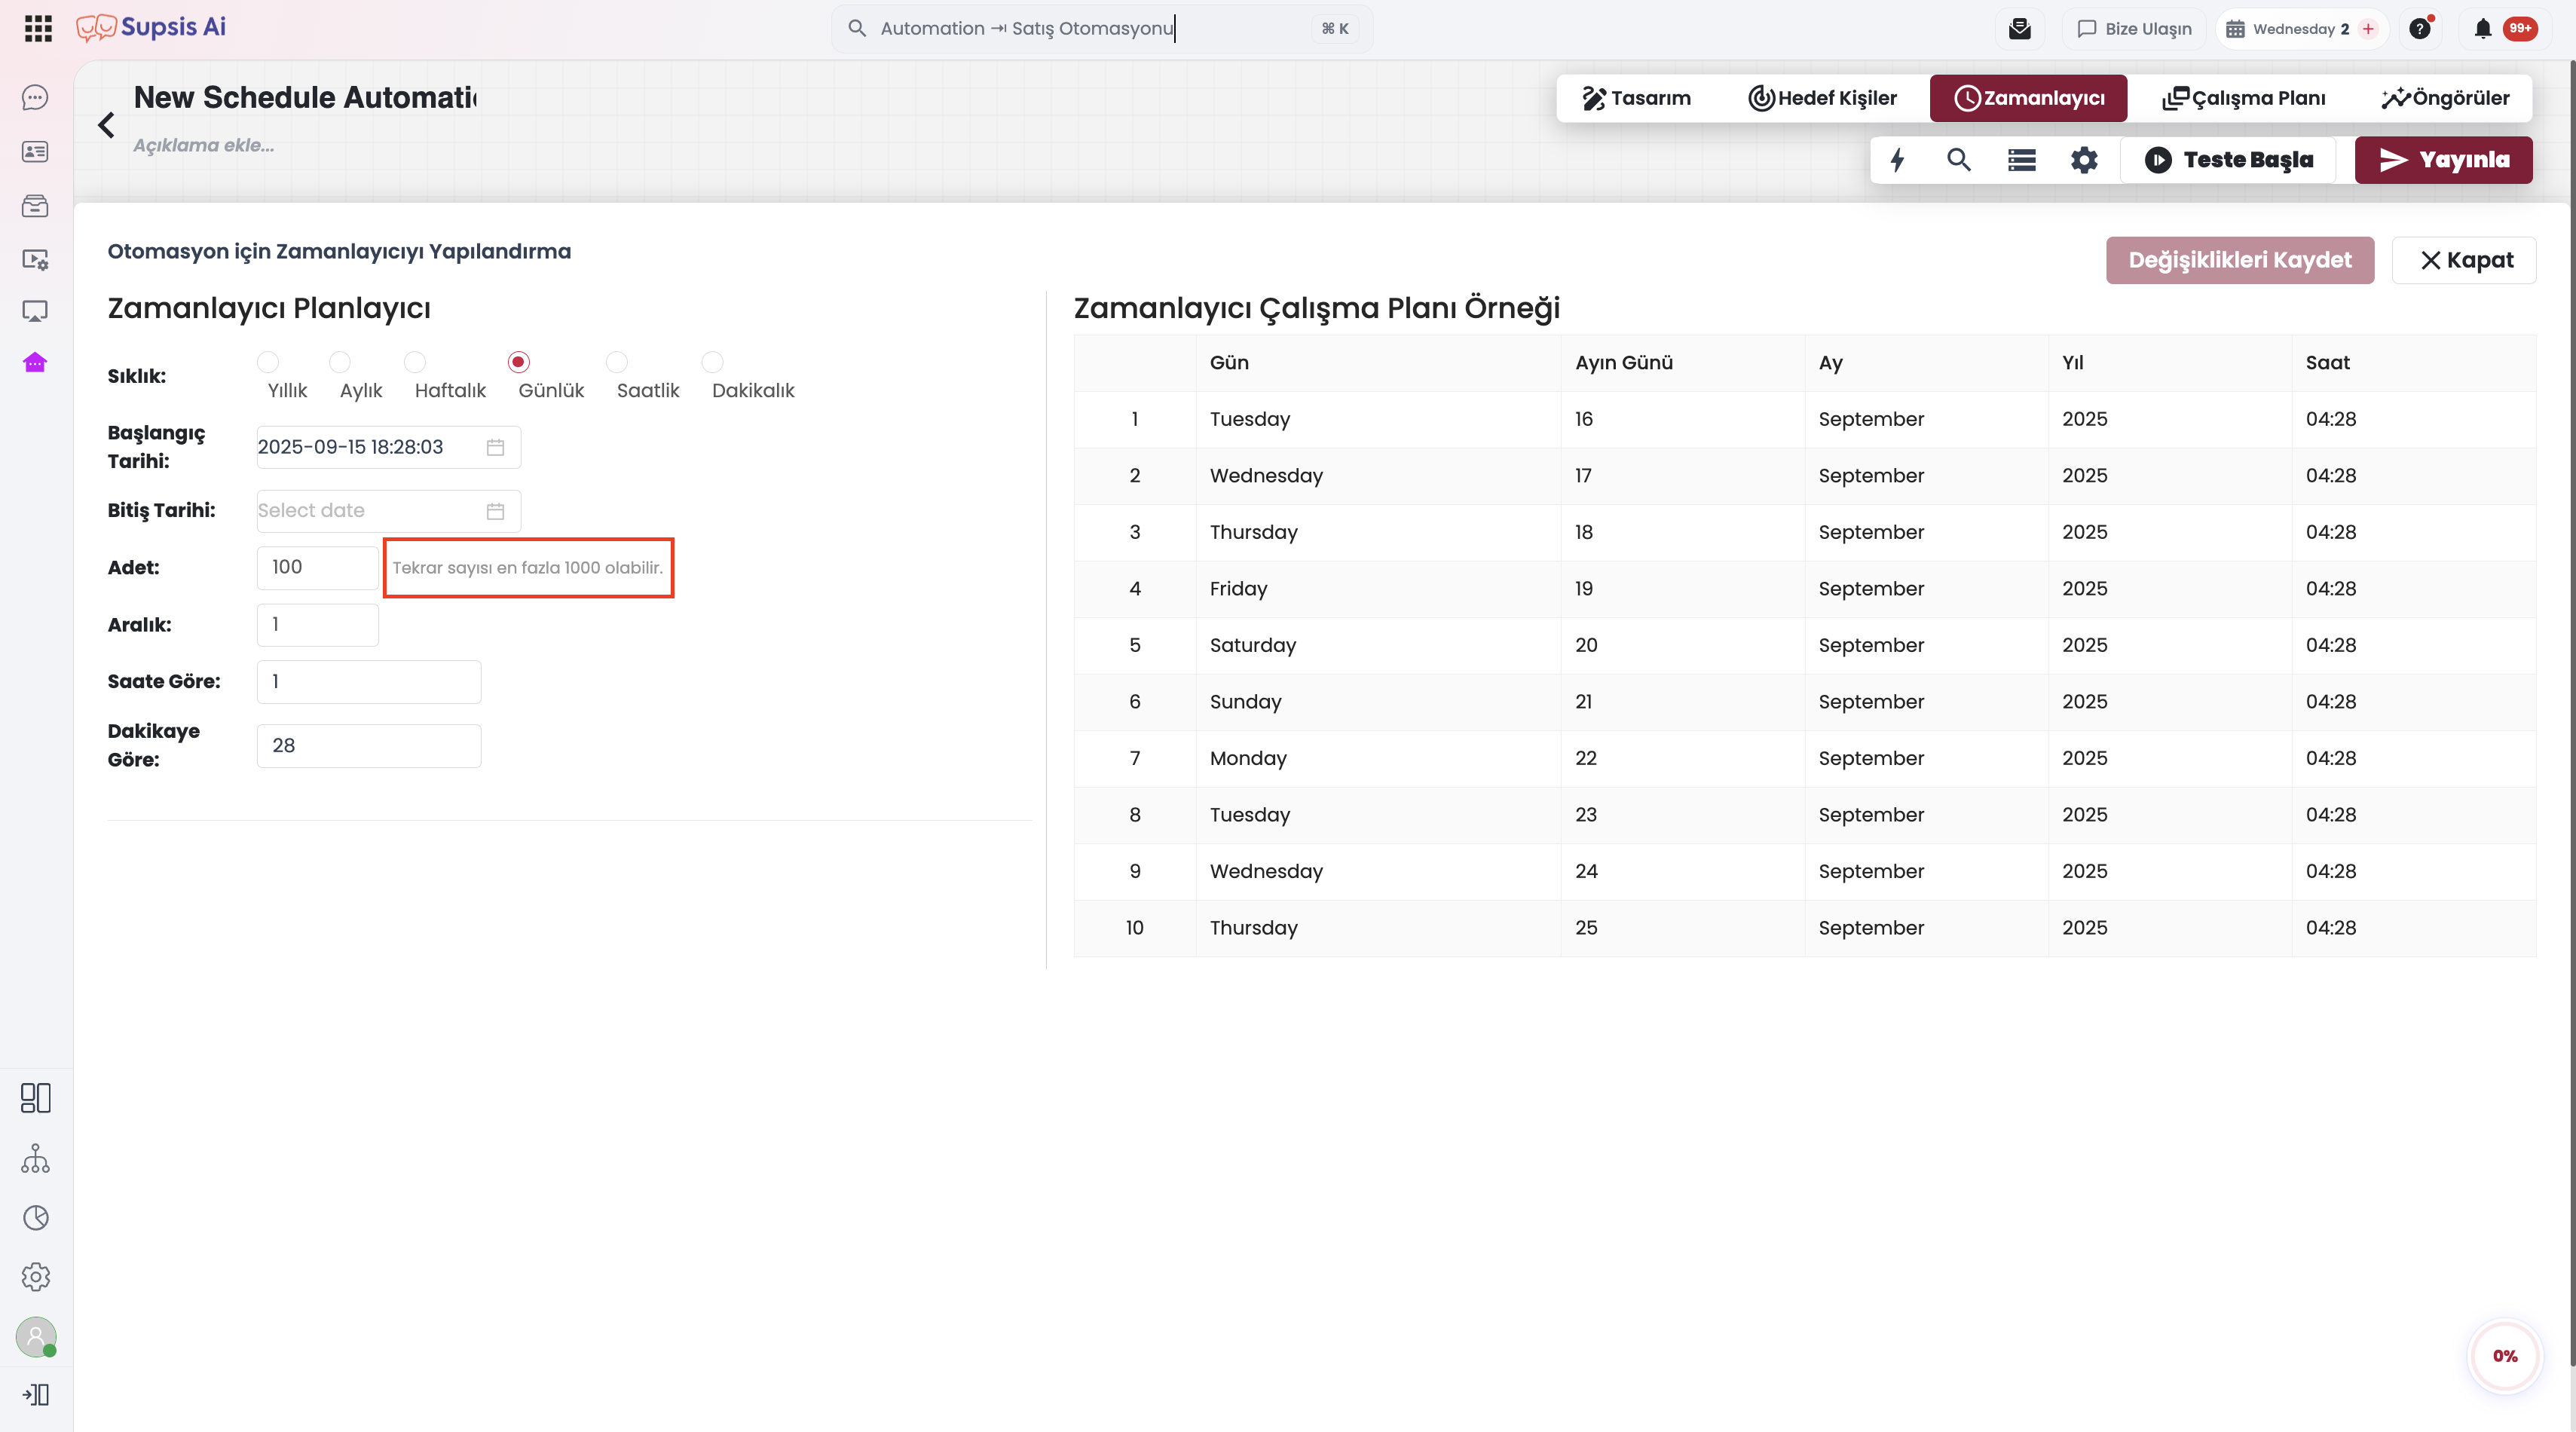
1000 Count Limit & Schedule Renewal
The upper limit for planned repetitions (Count) in scheduler automations has been increased to 1000.
- Maximum 1000 Runs: A single scheduler plan can be scheduled for up to 1000 runs.
- Completion & Inactivity: Once all 1000 planned runs are completed, the automation halts execution and does not restart automatically.
- Renewing the Scheduler: To continue execution for a new cycle after completing 1000 runs, open the scheduler panel, set a new start date and repeat count, and re-save the plan.
Automations Are Not Deleted
Completing 1000 repetitions does not delete or break the automation; only the active schedule quota ends. Updating and saving the scheduler reactivates the automation for the new term.
Step-by-Step Configuration Guide
Follow these steps to configure and activate a scheduled automation:
- Navigate to Automations: In Customer Panel, go to Automations → Scheduled Automations.
- Open Automation: Open an existing timer automation or click + New Automation.
- Open Scheduler Panel: Click the Scheduler tab located in the top menu of the designer.
- Define Schedule Rules:
- 4.a- Select the Frequency (Daily, Weekly, Monthly, etc.).
- 4.b- Set the Start Date and execution time.
- 4.c- Enter the planned repetitions in the Count field (Maximum 1000).
- 4.d- Specify the Interval if needed (e.g., every 2 days).
- Inspect Preview: Verify future trigger dates and times on the live schedule preview table.
- Save Changes: Click Save Changes to activate the schedule.
Scheduler Live Execution Preview
The preview table allows you to check estimated future execution timestamps before deployment.
Refreshing the Preview
After altering scheduler parameters, click the Save Changes button to update and refresh the preview table.
Use Cases and Benefits
| Use Case | Configuration | Benefit |
|---|---|---|
| Daily Periodic Sync / Report | Frequency: Daily, Count: 1000 | Operates continuously for up to ~3 years (1000 days) without requiring annual reconfiguration. |
| Weekly Campaigns & Follow-ups | Frequency: Weekly, Count: 1000 | Provides autonomous weekly execution spanning up to ~19 years. |
| Bi-Daily Reminders | Frequency: Daily, Interval: 2, Count: 180 | Triggers predictably every 2 days for an entire year. |
Important Control & Compatibility Notes
Plan Quota and Permissions
The 1000 repetition limit applies to individual execution cycles within a schedule plan; it does not alter account-level automation limits or package restrictions.
Existing Automations
Existing automations previously configured with 365 runs are not automatically updated. To benefit from the 1000-run ceiling, edit the scheduler and save the new repetition count.
Integration Rule Limits (Ticimax, etc.)
This update applies exclusively to the Supsis Automation Designer Scheduler (Timer) module. Rule limits in external ecommerce connectors (such as Ticimax's 365 limit) remain separate.
By Minute: 0
1.c – Event-Based Automations
This automation type is triggered by operations (events) occurring in your Supsis AI panel. When the panel operation defined as the trigger occurs, the automation flow is triggered.
When triggered, the automation becomes active with the data of the triggering event and performs the operations defined by the blocks according to the diagram rules.
For example, it is activated when a new task is created, a new lead record is added, a new table record is created or updated, or when a user completes a specific action. In this way, your system can instantly respond to the events you define and automatically initiate the necessary actions.
Creating an Event-Based Automation
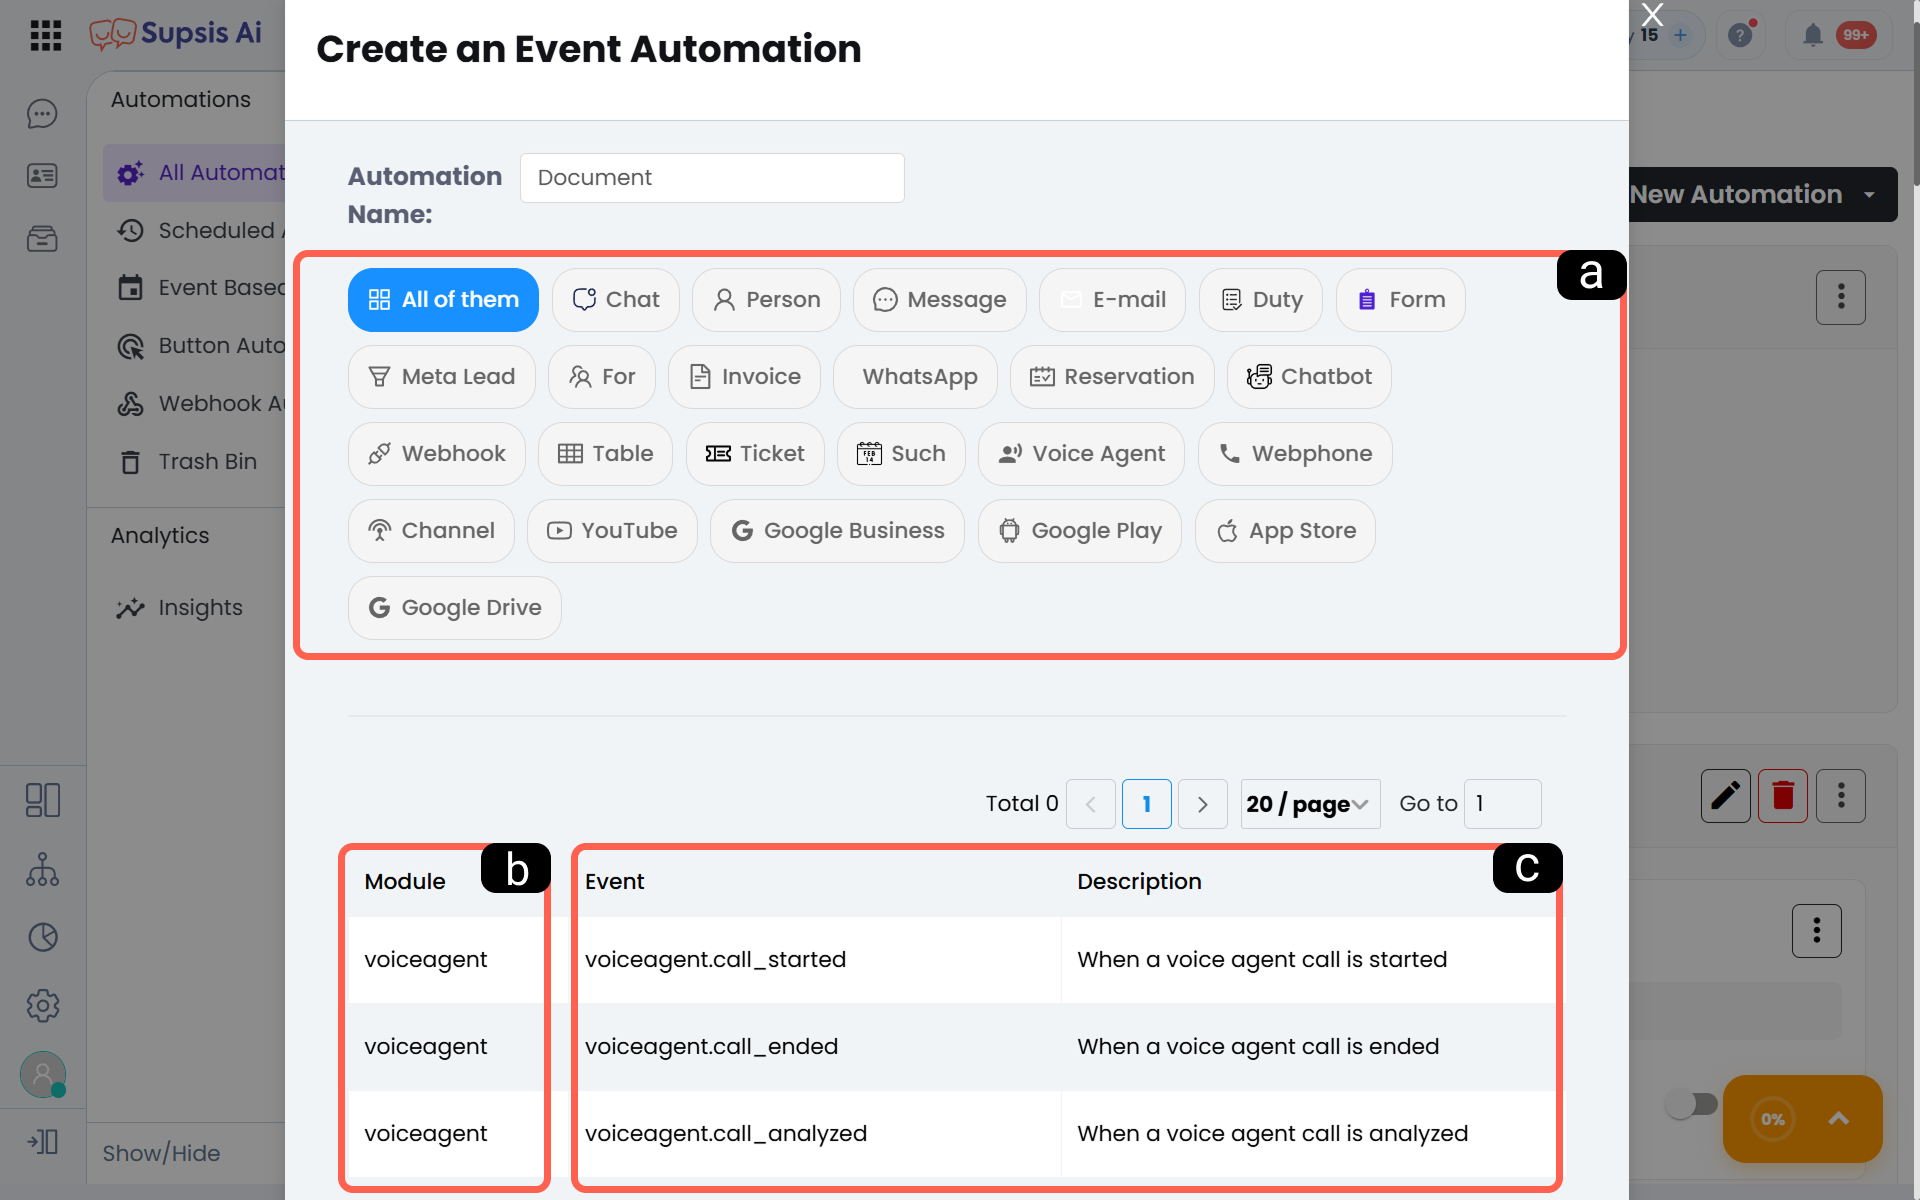
a. Trigger Category Filter
This section is the module filtering area you can use to determine the Supsis AI source that will trigger the automation. All integrations and modules in the Supsis AI ecosystem that can trigger event-based automation are categorized here.
Whichever module icon you select in this field, only the trigger events belonging to that category are listed in the table below.
b. Trigger Category
This column shows the technical identity of the selected trigger category within the system and the main structure it belongs to. It is used to verify from which backend service the automation trigger originates.
c. Category Event and Description
This field is the most critical part that determines when the automation will be activated. It consists of two main columns:
- Event: The "Event" name technically tracked by the system. (For example; voiceagent.call_started). These names are used as trigger parameters in external integrations.
- Description: It is the counterpart of the technical event on the panel side. It explains in a clear language exactly when the process will start (for example; "When an artificial intelligence call starts").
Voice Agent Call Trigger Events
Event-based automations support specialized trigger events for AI Voice Agent calls:
voiceagent.call_started(When Voice Call Starts): Triggered instantly when the AI voice agent initiates a phone call with a customer.voiceagent.call_ended(When Voice Call Ends): Triggered as soon as a phone call is completed (used e.g. for sending follow-up WhatsApp messages or updating CRM status).voiceagent.call_analyzed(When Call Summary & Analysis Generated): Triggered when AI-generated call summaries, sentiment analysis, and action items become available after a call.
AI-Powered Pre-Filtering for "On Email Received" Automations
In automation flows triggered by incoming emails in the Supsis AI panel, a Pre-Filtering structure is used to prevent all messages from unnecessarily triggering the workflow and to enable AI-powered automation management.
- AI-Powered Analysis: Incoming emails are analyzed instantly using AI-powered Sentiment Analysis and AI Summary Generation features to assign them to the correct pre-filter group.
- Pre-Filtering Configuration Steps:
- Field Selection: The data field to be filtered is selected (e.g., Sender, Subject, Email Body, etc.).
- Operator: The comparison logic is selected (e.g., Contains, Equals, StartsWith, EndsWith, etc.).
- Entered Value: The target text or phrase to base the filter on is entered.
- Example Usage Scenarios:
- Sender Domain Filter: To catch emails originating from sender addresses containing
"gmail.com", setField: Sender|Operator: Contains|Value: gmail.com. - Subject-Based Automated Routing: To filter emails containing
"support"in the subject line, setField: Subject|Operator: Contains|Value: supportso that matching emails are directly routed to the support team's automation flow.
Automation Data
When event-based automations are triggered, they have all the information belonging to the event that started the process. These data can be read directly from within the automation diagram and processed through blocks.
How to Read Event Data in Automation
To read event data, you can enter the automation block where you want this data to be processed and follow the steps below.
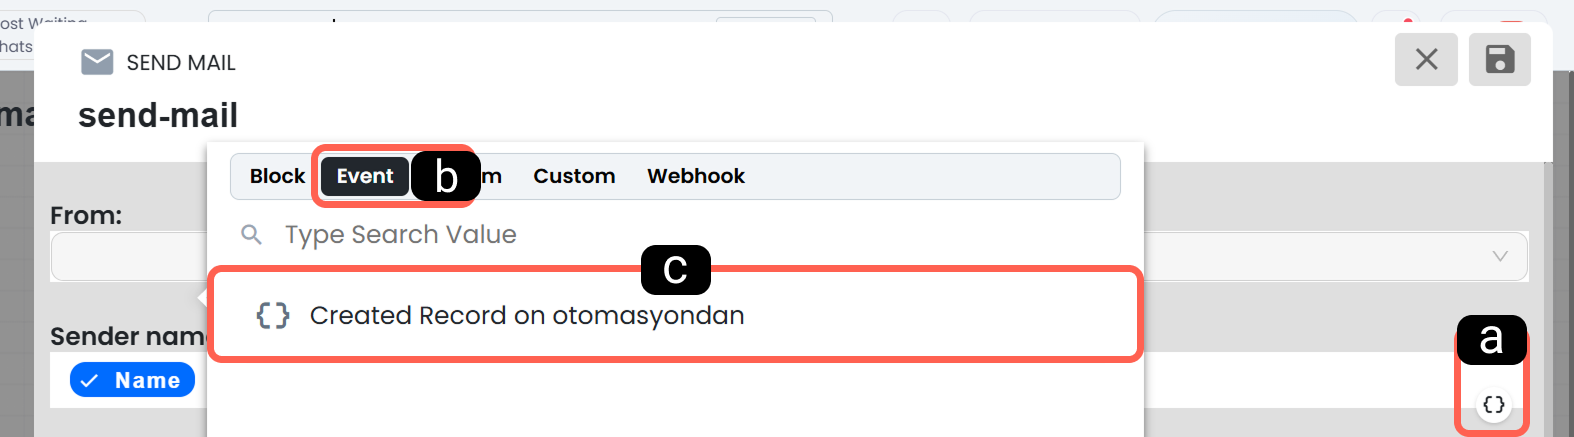
a. Automation Data
This is the area where the current data available in the automation is located. You can access all the data owned by the automation through this button.
b. Event Data
This is the section where you can read the specific data belonging to the triggering panel operation that triggered the automation.
c. Trigger Content
This is the area where all structural data and ID information in the background of the triggering event process (record creation, status change, etc.) are accessed. The data content here may vary depending on the content structure of the triggering event.
1.d – Button Automations
These are automation scenarios designed to be triggered semi-automatically when the buttons defined in the interfaces of Supsis AI modules are clicked. It allows Supsis AI users to bind actions according to their instant needs in the relevant module and run custom workflows instantly whenever desired.
1.e – Webhook Automations
This automation type is triggered by HTTP requests sent from external systems to the Supsis AI automation URL. When triggered, the automation becomes active with the data content received from the Webhook and performs the operations defined by the blocks according to the diagram rules.
Additionally, Webhook automations can send a response back to your external system regarding whether the operation was successful thanks to the “Respond to Webhook” feature.
This structure makes it possible to establish integration between Supsis AI and external sources and automates the flow of information between systems from end to end.
Automation Data
Webhook automation can read the data content sent to the relevant automation URL and process the received data through automation blocks.
This structure makes it possible to establish integration between Supsis AI and other applications and automates the flow of information between systems.
Accessing the Webhook Menu of the Automation
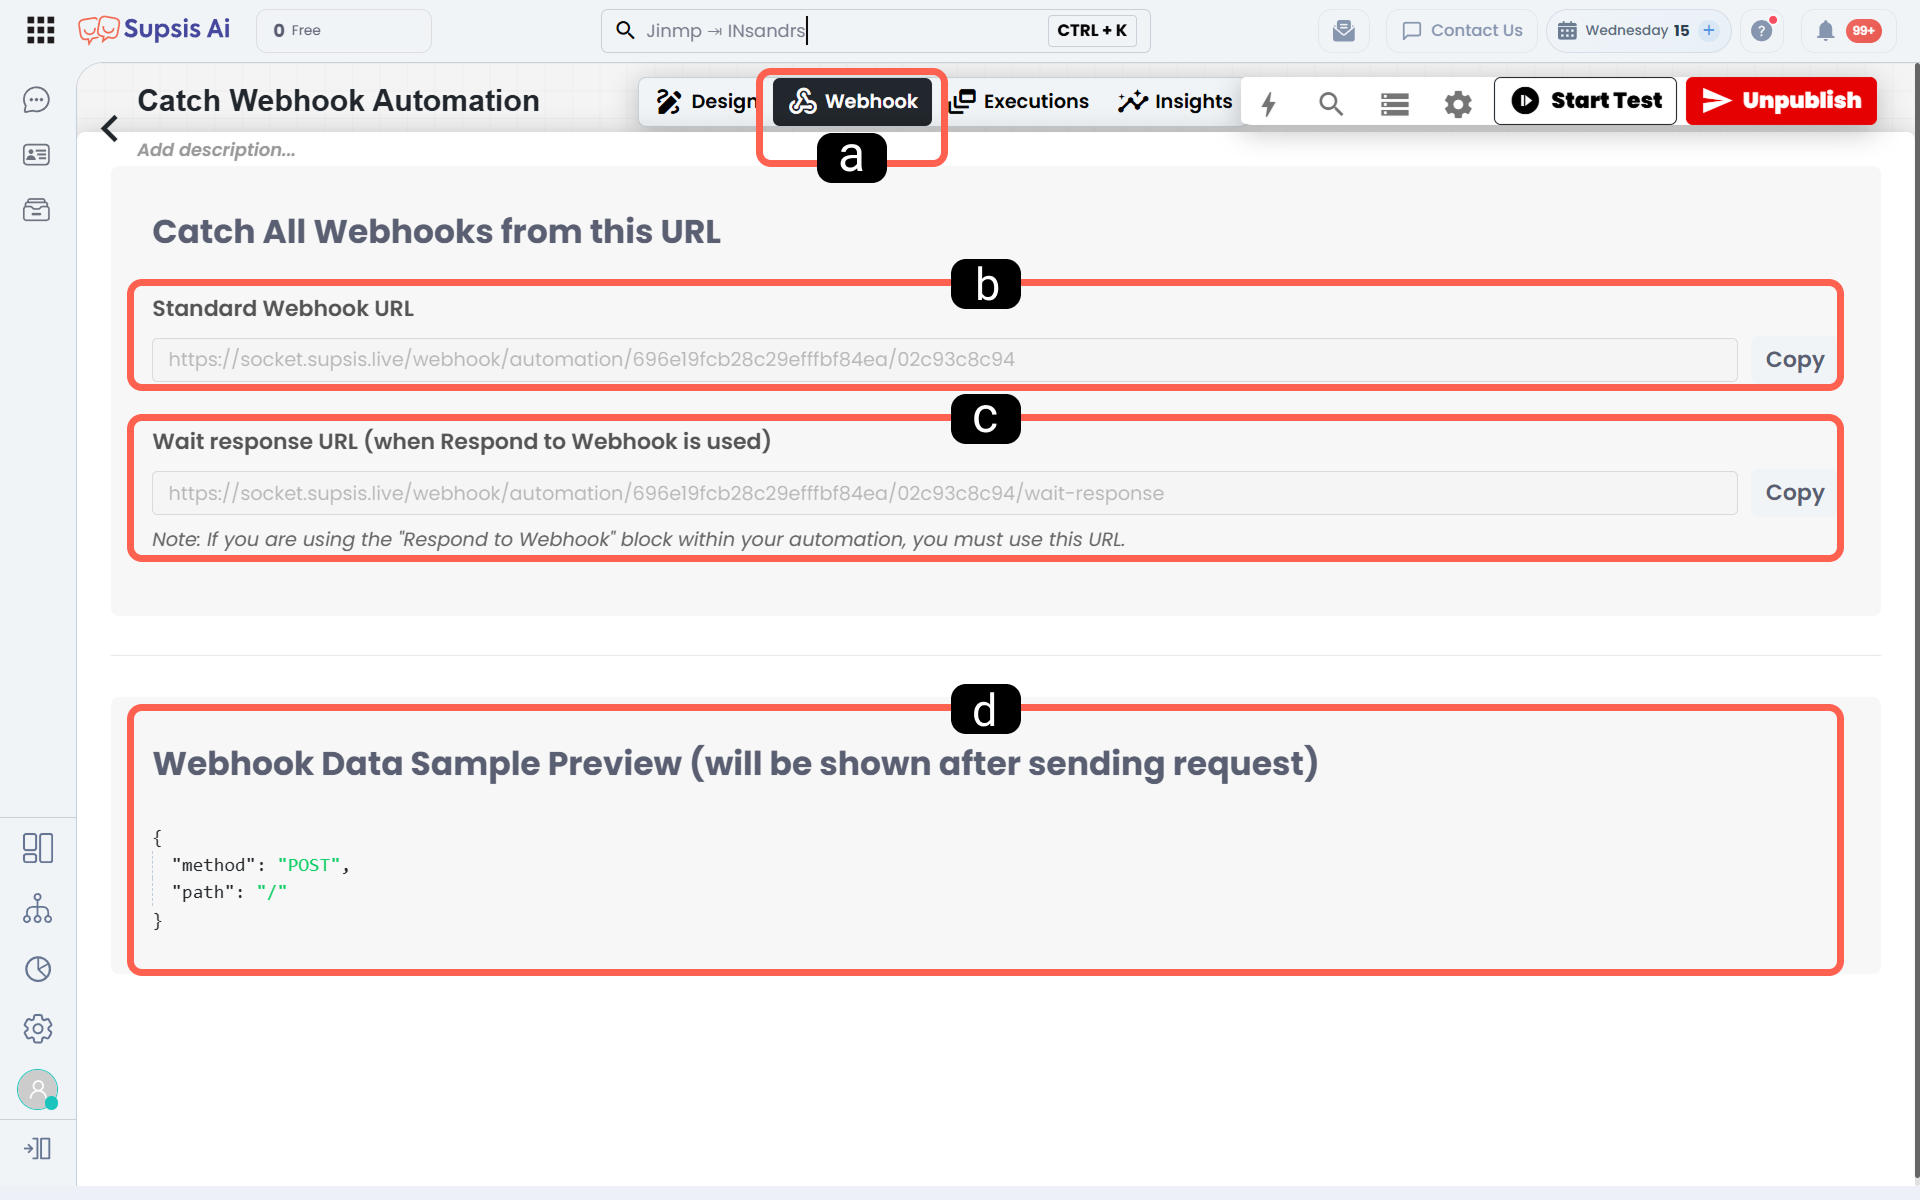
a. Webhook Menu
It is the main settings menu where you can configure the Webhook settings of the relevant Webhook automation.
b. Standard Webhook URL
It is the Supsis AI listening address that you will integrate into your external system and that will accept HTTP requests. HTTPS requests are sent to this URL.
c. Waiting Response URL
It is the response address that will report the waiting status of incoming requests during the processing phase to the external source and return a response.
d. Preview of the Last Received Data Content
It provides a preview of the last HTTP request (data content) that successfully reached the URL in JSON format.
How to Read Webhook Data in Automation Data Reading Wizard
This wizard presents the data packet coming to the automation's Webhook URL in a hierarchical structure as objects and keys.
The wizard is based on the last sent sample JSON schema while displaying the data. Therefore, send a sample JSON schema of the data you want to read to the Webhook URL; the system will reflect the schema you sent exactly to the preview. You can easily read the data you want by selecting JSON objects from the directories of your schema
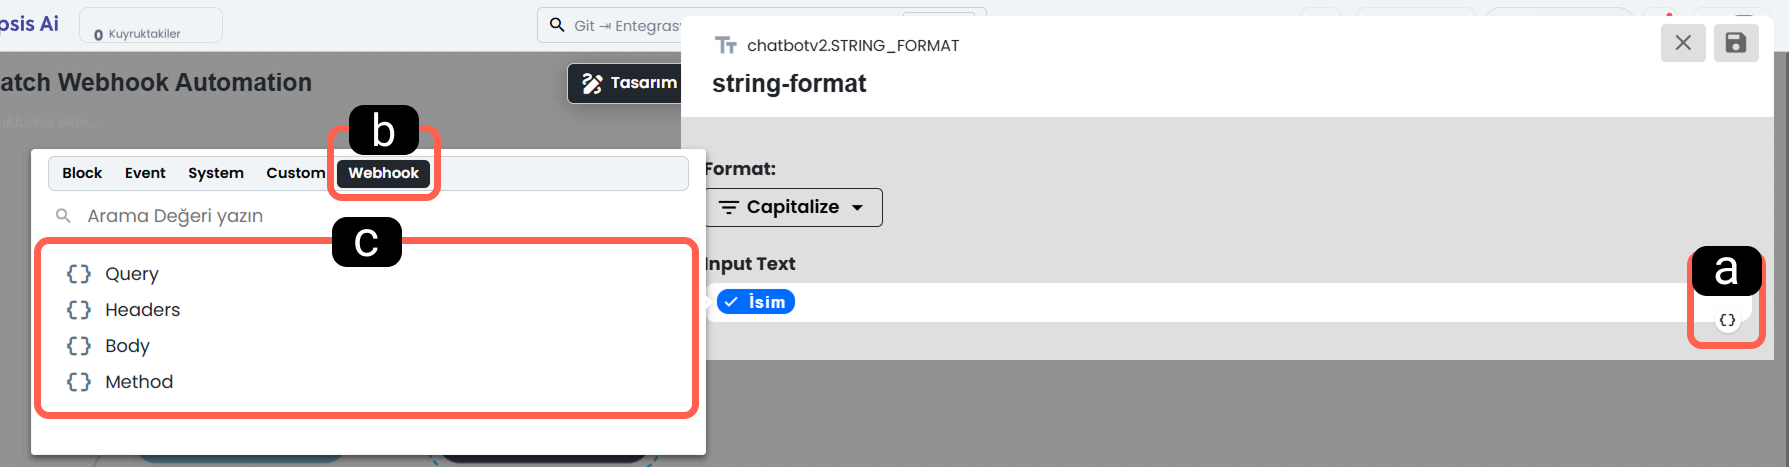
a. Automation Data
This is the area where the current data available in the automation is located. You can access all the data owned by the automation through this button.
b. Event Data
This is the section where you can read the specific data belonging to the triggering HTTPS content that triggered the automation.
c. Trigger Content
This is the area where you can access all directories of the webhook content that started the event from the top object to the sub-object. You can reach the key value of the data you want to read by selecting the object hierarchically.
Reading Data via Path
It is the method of manually defining the path of the specific data field intended to be used in the automation into the relevant block.
In order for the automation to read dynamically incoming Webhook data, a dot (“.”) must be placed between each key in the JSON schema according to the object hierarchy, and the value must be enclosed in double curly braces ( {{ }} ).
To create curly braces:
On Windows;
{ => for CTRL+7,
} =>, for CTRL+0,
On MacBook;
{ for => Option+7,
} for =>, for Option+0,
you can use the buttons.
Operation Example
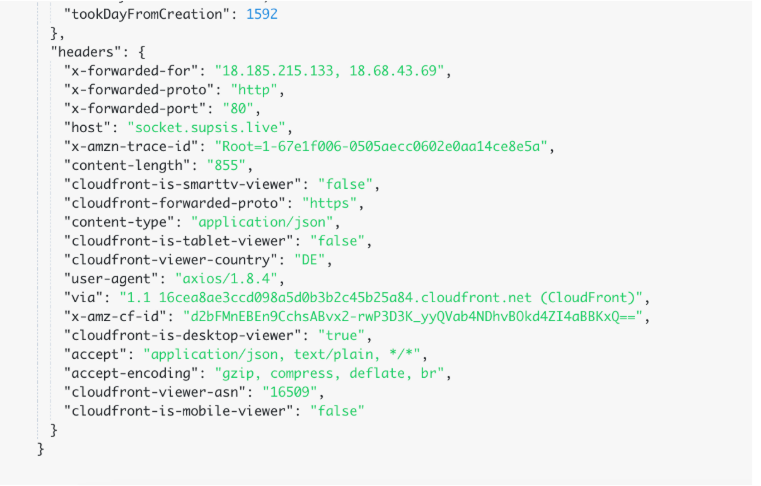
Let’s assume that we want to use the value “socket.supsis.live” from the Webhook data content in the visual within the automation. In order to use this value within the automation; the path equivalent of the “host” key that holds the data must be written inside the block that will process the data.
To write the path equivalent of the “host” key that holds the value “socket.supsis.live” we want to use, we can first take the Webhook, which is the method from which we received the data, then the headers object that holds the host key, and finally the host value, which is the key that holds the data.
A “.” should be added between each directory object in accordance with the hierarchical order, and the final path should be enclosed with 2 curly braces at the beginning and end to indicate that it is dynamic. Thanks to this definition, the system will automatically pull the dynamic data corresponding to the host key (in the example: socket.supsis.live) into the block.
The resulting path value for our example operation should be as follows =>{{webhook.headers.host}}
1.f – Trash
It is the area where deleted automation scenarios are temporarily stored. To prevent possible accidental deletions, you can restore an automation you previously deleted from the trash at any time or permanently remove it from the system.
Note: If an automation moved to the trash is not restored within 30 days, it is permanently deleted from the system.
2. Analysis (Statistics)
It is the analysis menu where you can track the overall performance and usage data of the automations running in your system in detail. Through this area, you can examine how often your scenarios are triggered, their success rates, and statistical reports of executed tasks. By making data-driven analyses, you can easily optimize your business processes and automation efficiency.
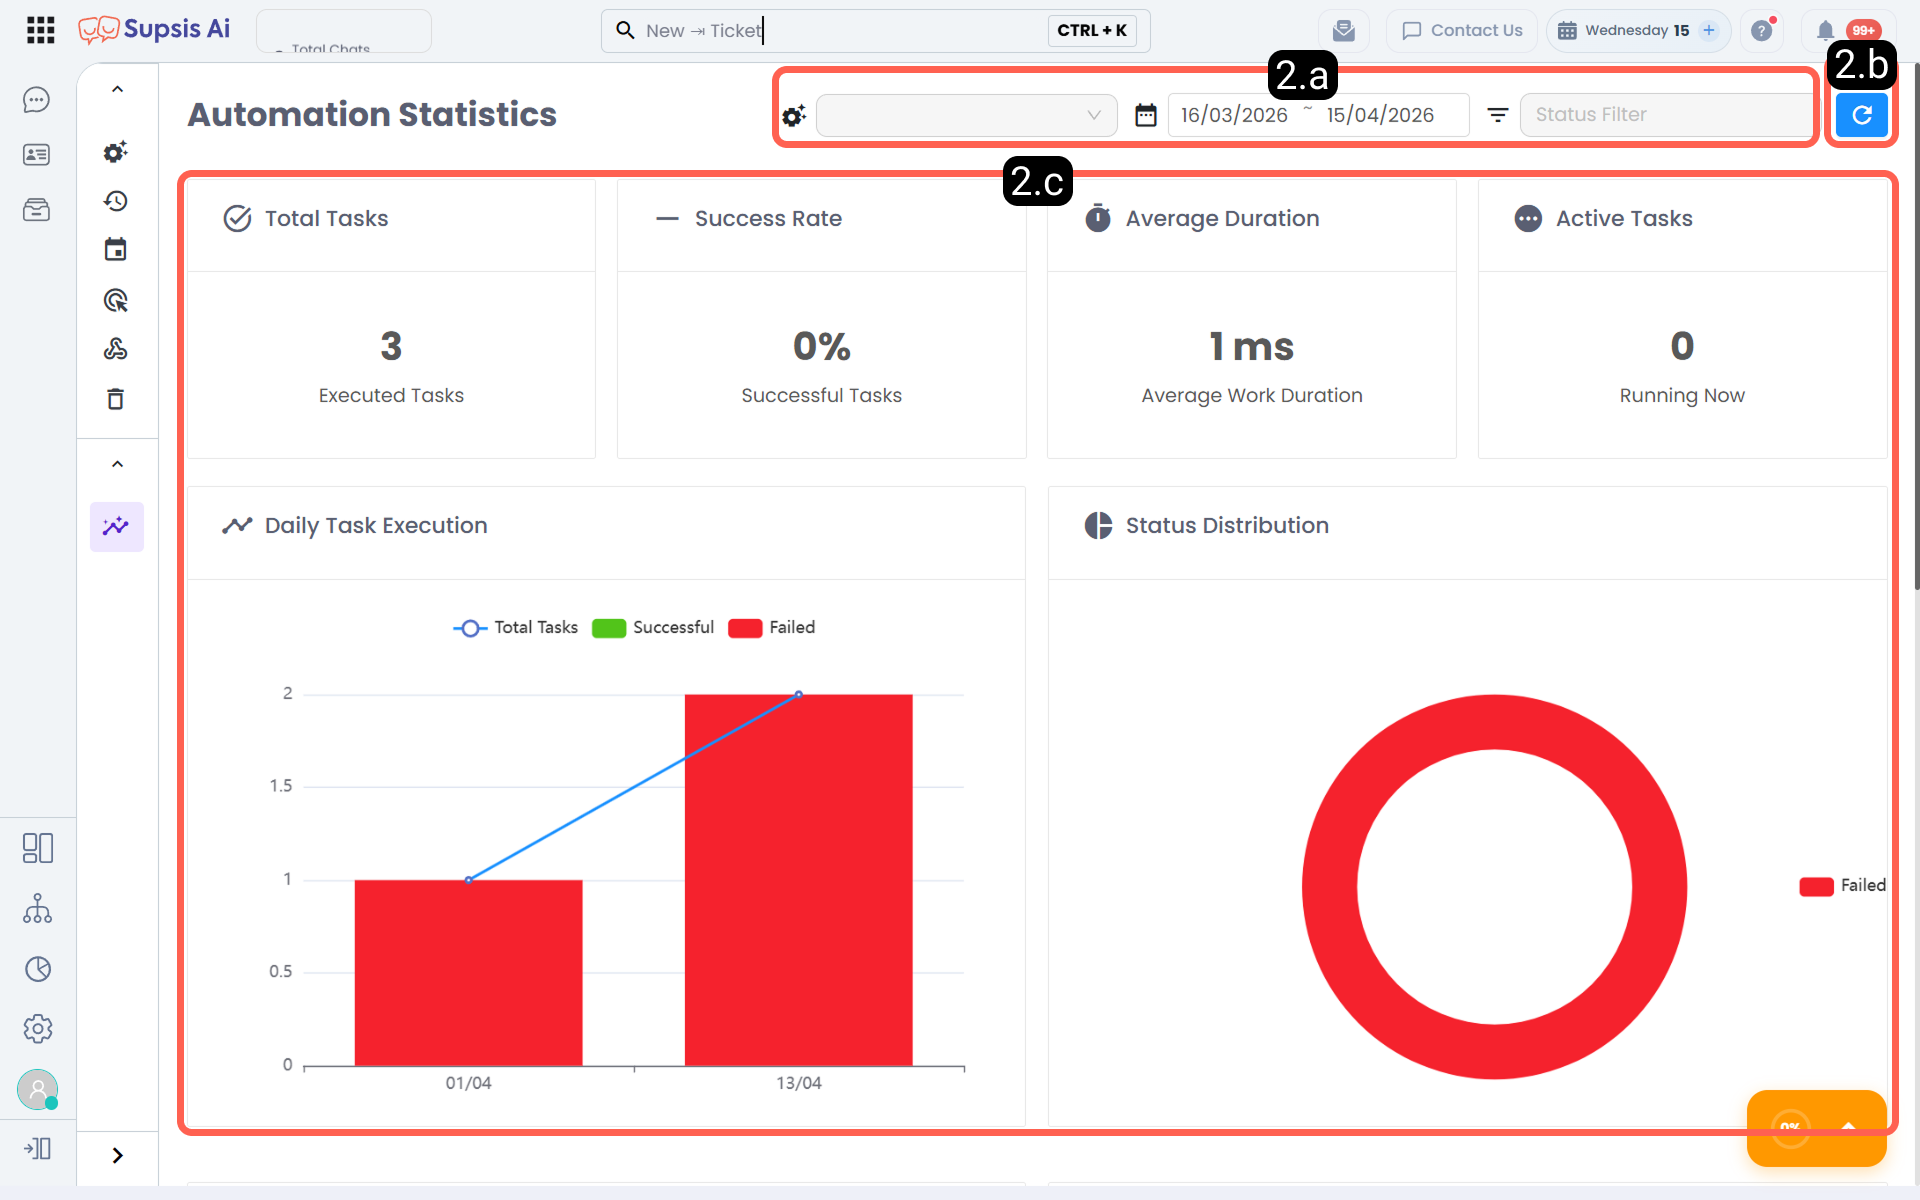
2.a – Filters
Filters are tools that allow you to narrow down the data on the analysis screen according to specific criteria and obtain more specific reports.
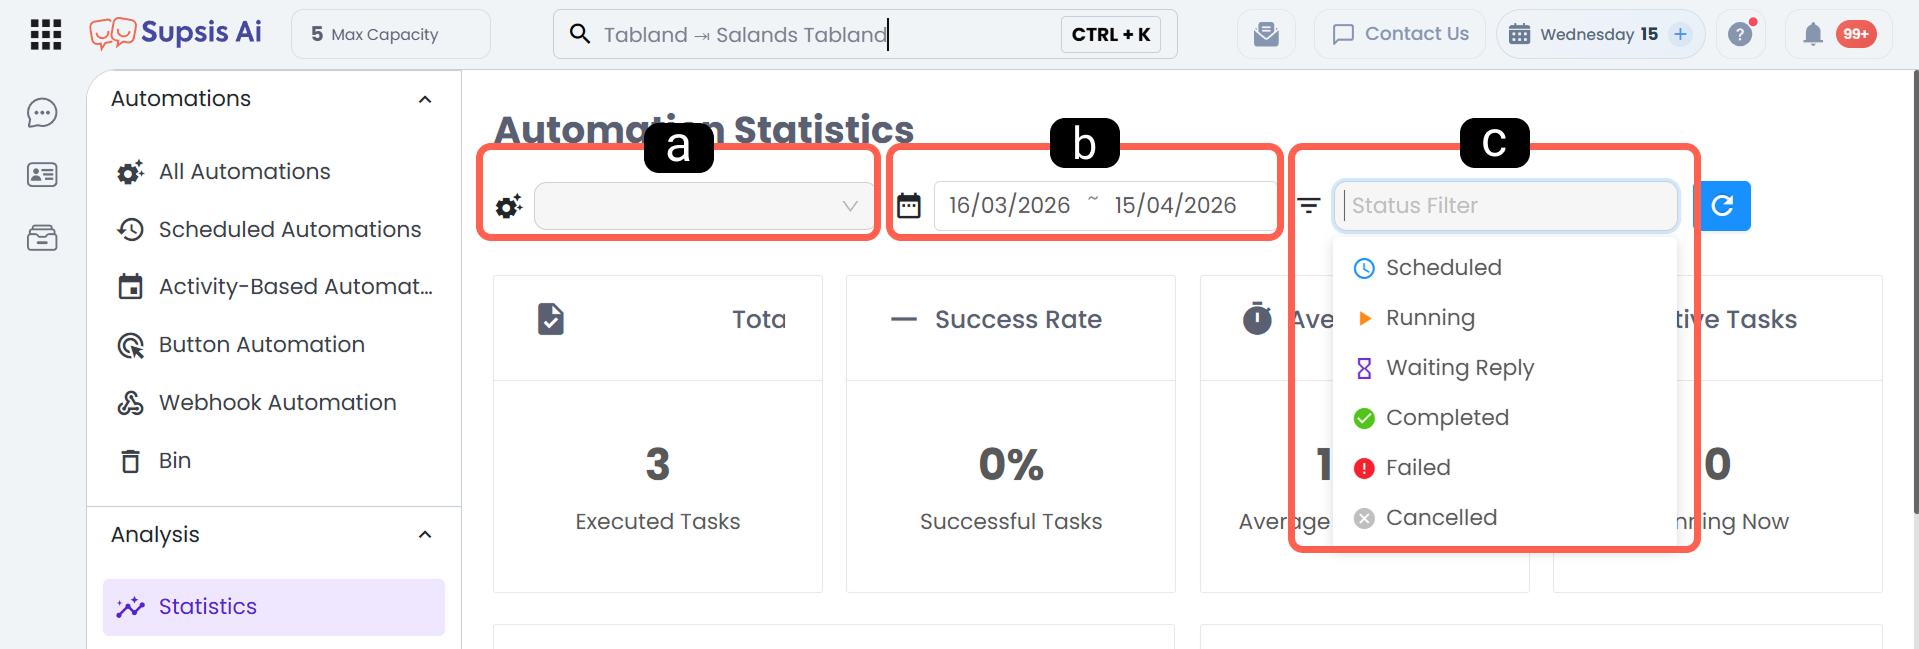
a. Automation Filter
It allows you to select a specific automation scenario whose statistics you want to view and examine only the automation data belonging to that flow.
b. Date Range Filter
It allows you to filter statistical data according to a specific date range you determine.
c. Status Filter
It accelerates error detection processes by filtering automation tasks according to their results (Successful, Failed, Pending, etc.).
2.b – Refresh Data Content
It refreshes the statistical metrics on the analysis page and ensures that the current automation data running in the background is instantly reflected on the screen.
2.c – Statistics
These are the key performance indicators (KPI) that show the overall health and processing capacity of your automations according to the criteria you filter.
- Total Tasks: The total number of automation operations triggered and executed within the selected date range.
- Success Rate: The percentage of operations completed without errors among the total executed tasks.
- Average Duration: It represents the average time taken for an automation scenario to complete from start to finish.
- Active Tasks: The number of automation tasks that are currently running in the system and have not yet been completed.
- Daily Task Execution: It graphically shows the distribution of tasks by days; it helps you identify peak processing days.
- Status Distribution: It is a visual graph showing the proportional distribution of task results (successful, failed, canceled).
- Duration Distribution: It is a performance graph showing fluctuations in task completion times and how long tasks are concentrated.
- Termination Reasons: It lists the reasons why tasks that are completed or interrupted are terminated by the system (e.g.: "Completed Successfully", "Timeout", "Invalid Data").
- Automation Performance: It is a comprehensive data table where the automation name, how long the automation performs tasks on average, the number of executions, the success rate, and the technical details of the operations performed can be viewed in detail.
3. Automation Table
It is the main control panel where all your automation scenarios are listed, organized, and where new actions are defined in the system. Through this area, you can manage your automation workflows comprehensively.
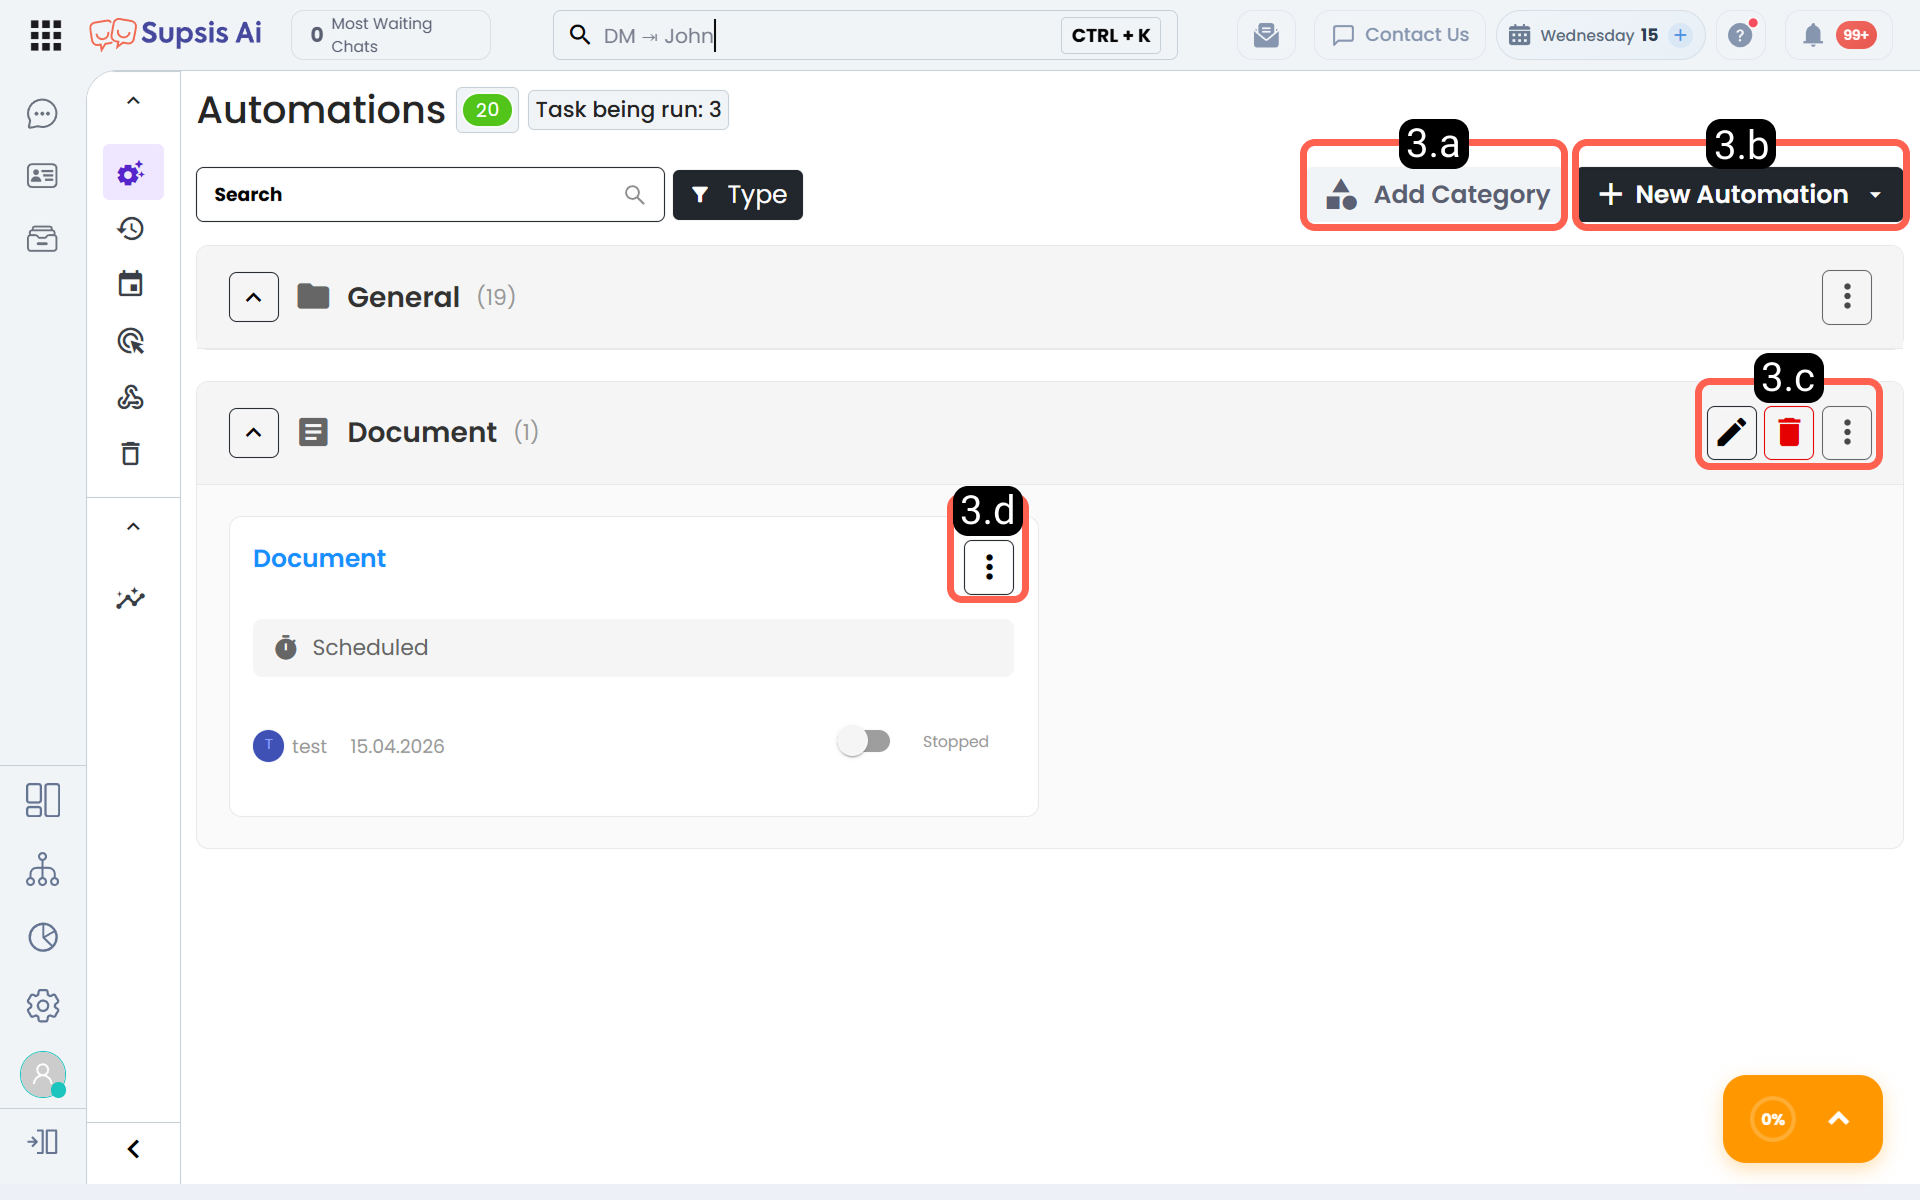
3.a – Add Category
It allows you to create new automation folders to group your automation scenarios according to your projects, departments, or functions.
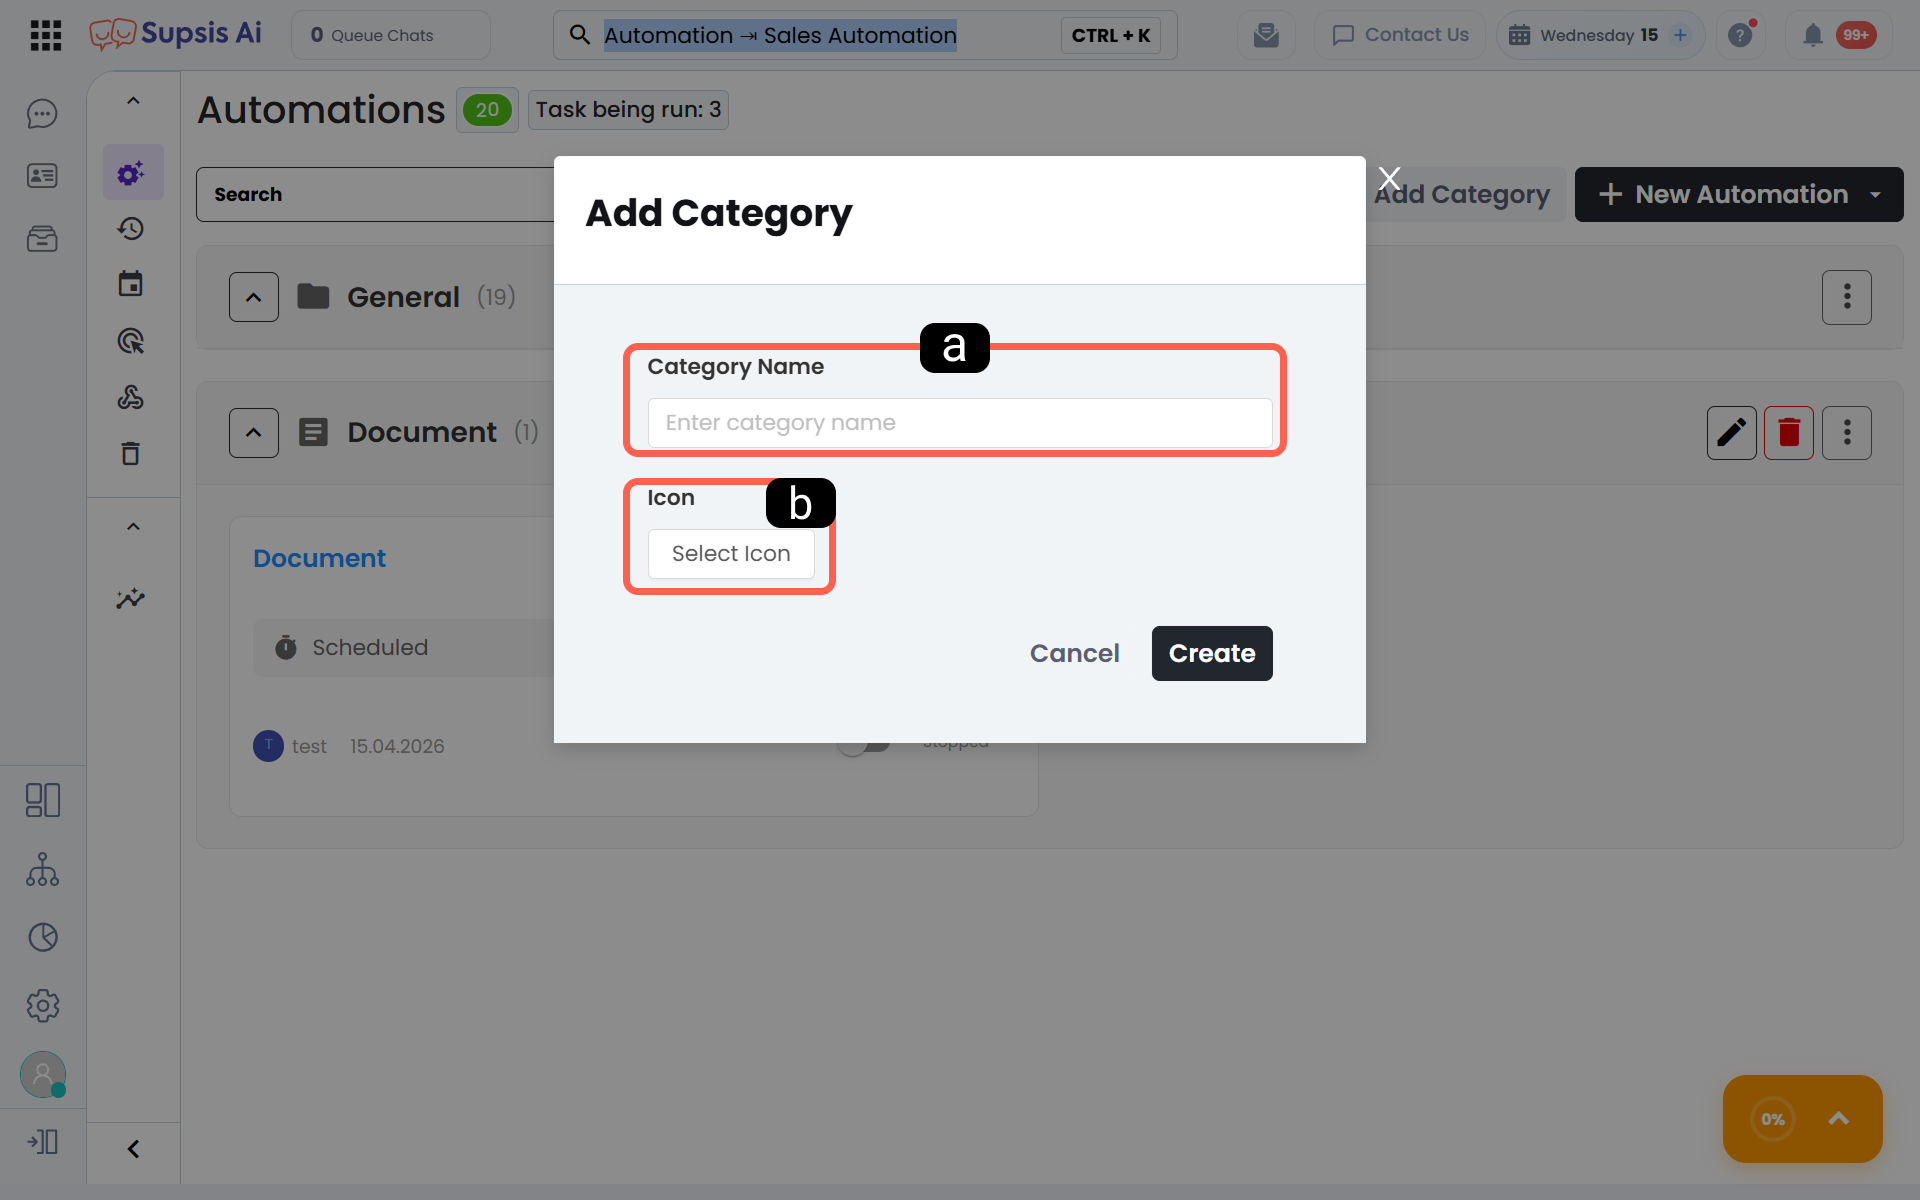
a. Category Name
It is the text field where you can give a clear and descriptive name to the folder you will create.
b. Category Icon
It is the symbol/icon selection area that you can assign to the category to facilitate visual distinction.
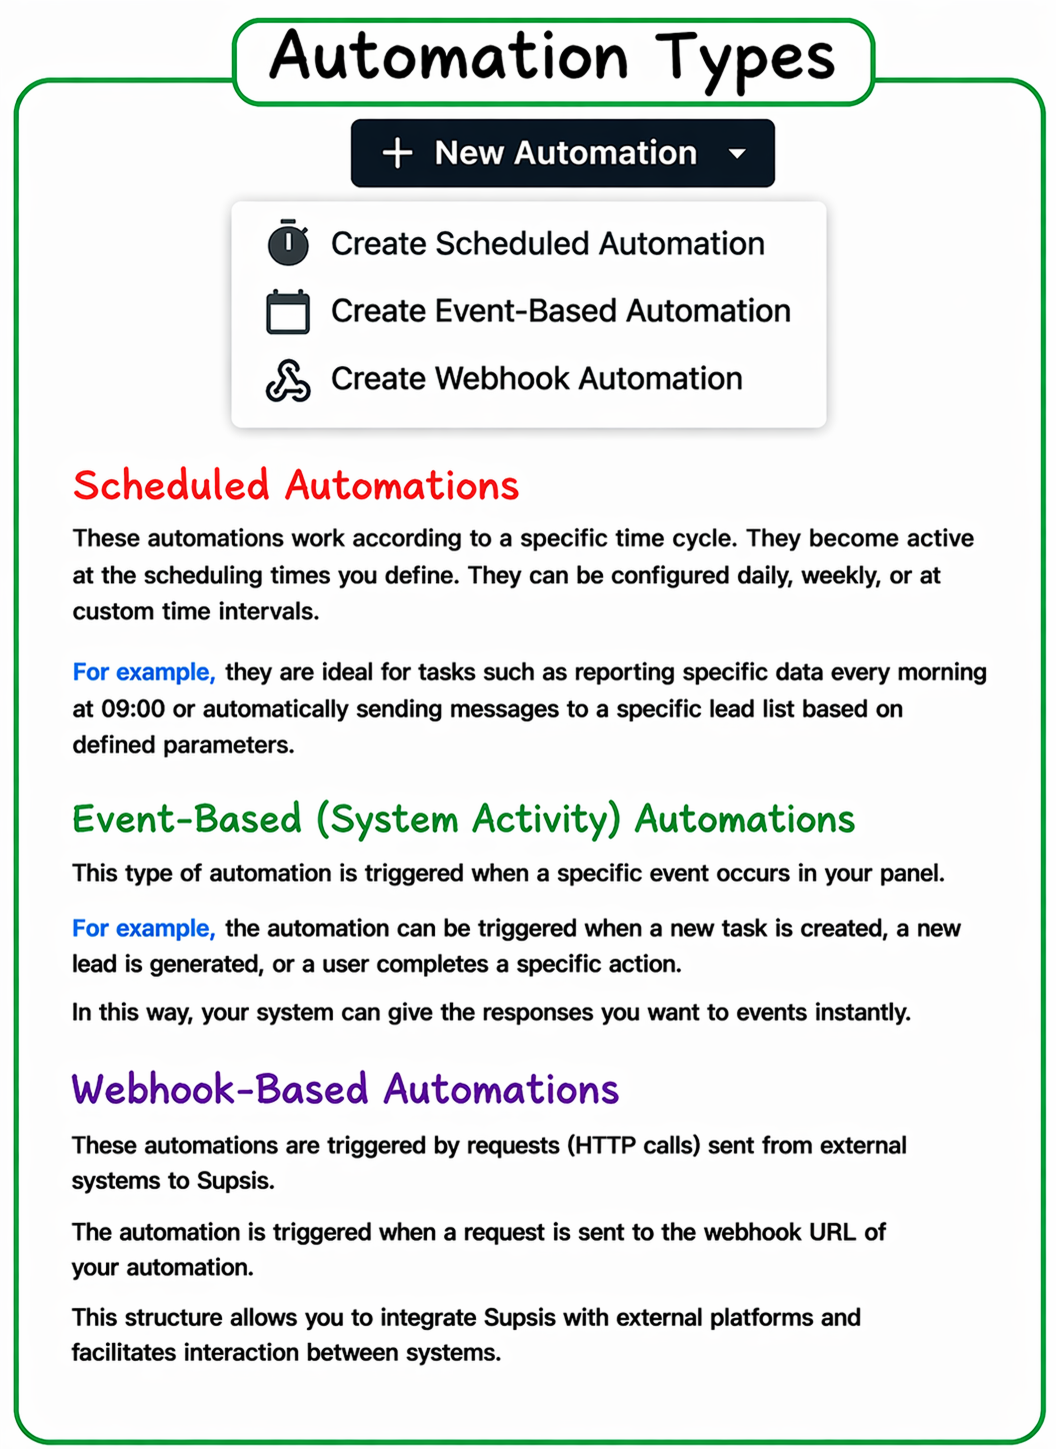
3.b – New Automation
It is the button that allows you to create a brand new workflow from scratch by launching the Supsis AI automation designer (diagram screen). For more information, see: Automations.
3.c – Category Operations
It is the management menu that allows you to make structural changes on your existing categories (folders).
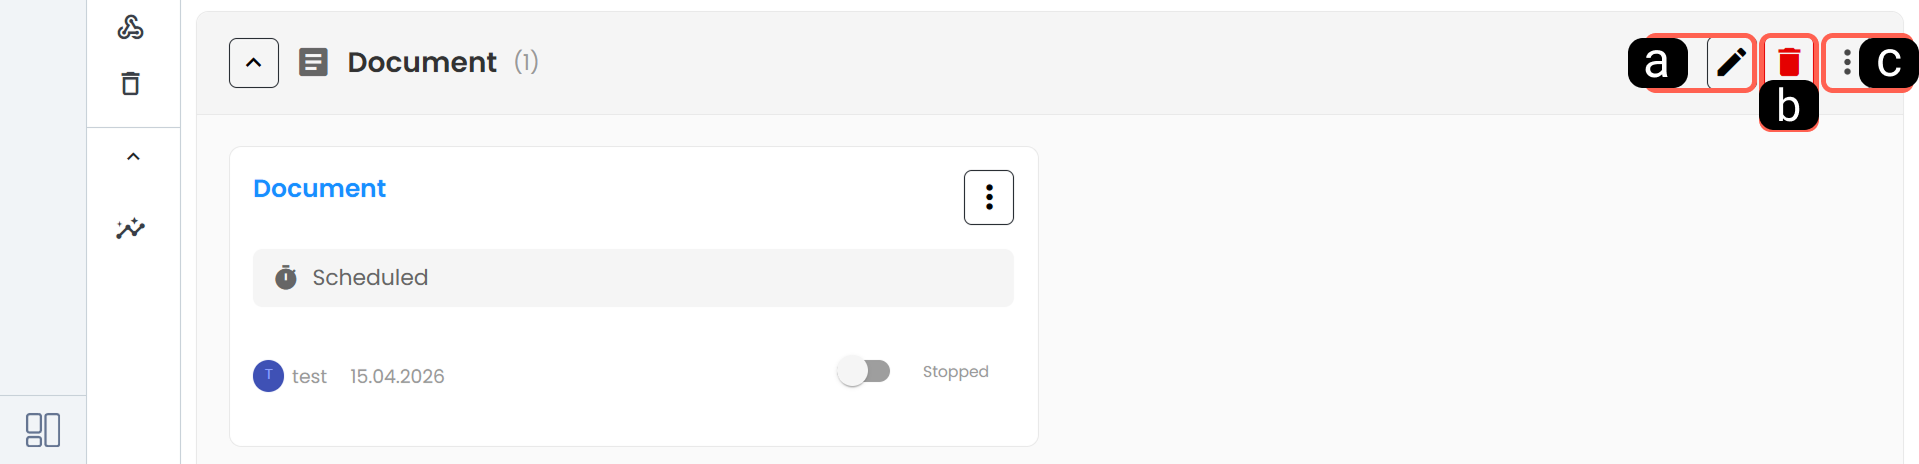
a. Edit Category Content
It allows you to later change the name and icon of an existing category.
b. Delete Category
It permanently removes the relevant category from the system.
c. Move Category Automations
Before deletion or for editing purposes, it allows you to transfer all automations within a category to another category in bulk.
3.d – Automation Operations
Through the menu located on the right side of each automation row listed in the table, you can perform specific management actions related to the relevant scenario.
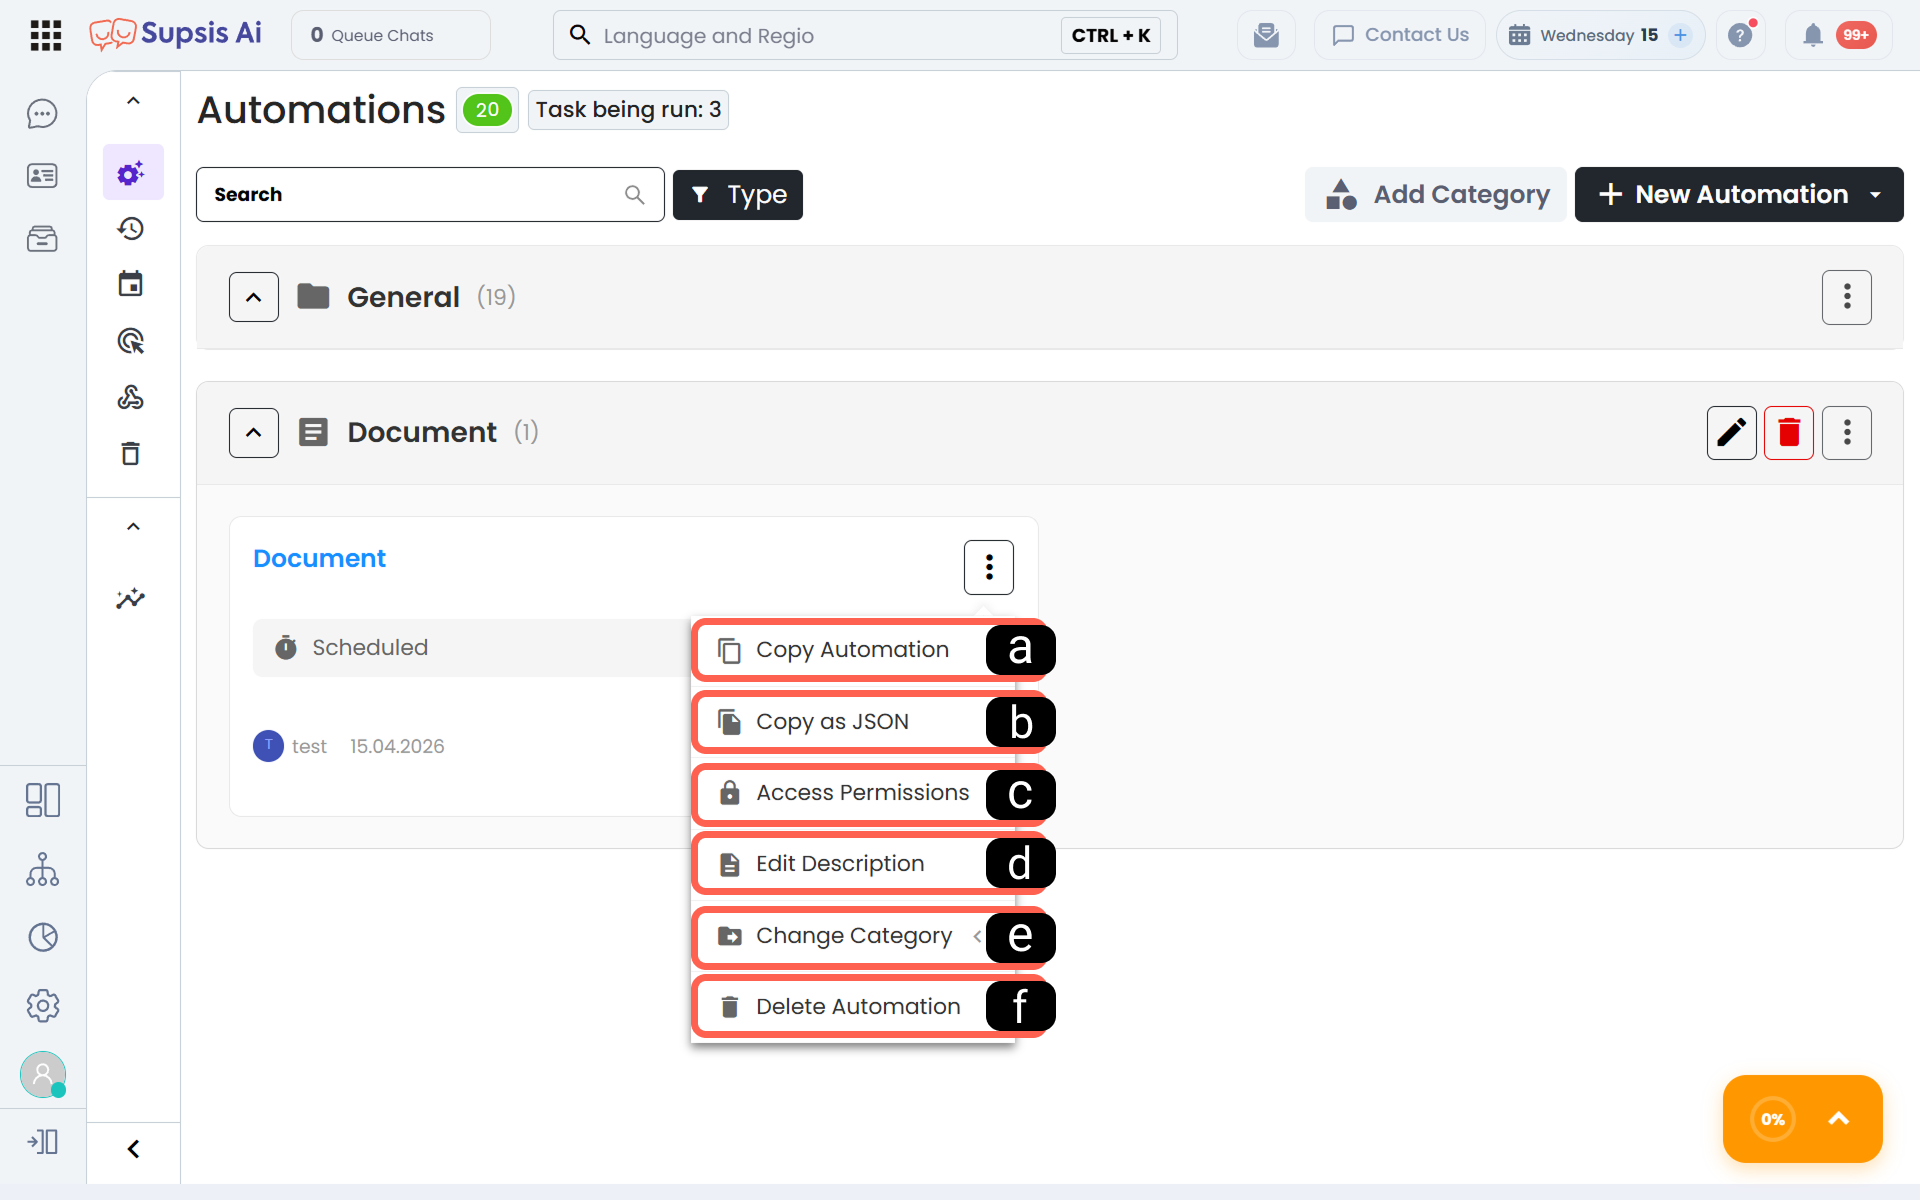
a. Duplicate Automation
It allows you to create an exact copy of the selected automation with the name “name of the copied automation (copy)” and use the copy of the existing automation within the same panel.
b. Copy Automation as JSON
It copies the structural code of the scenario (in JSON format) to the clipboard. This operation is used to export an automation, back it up, or transfer it to another Supsis AI panel.
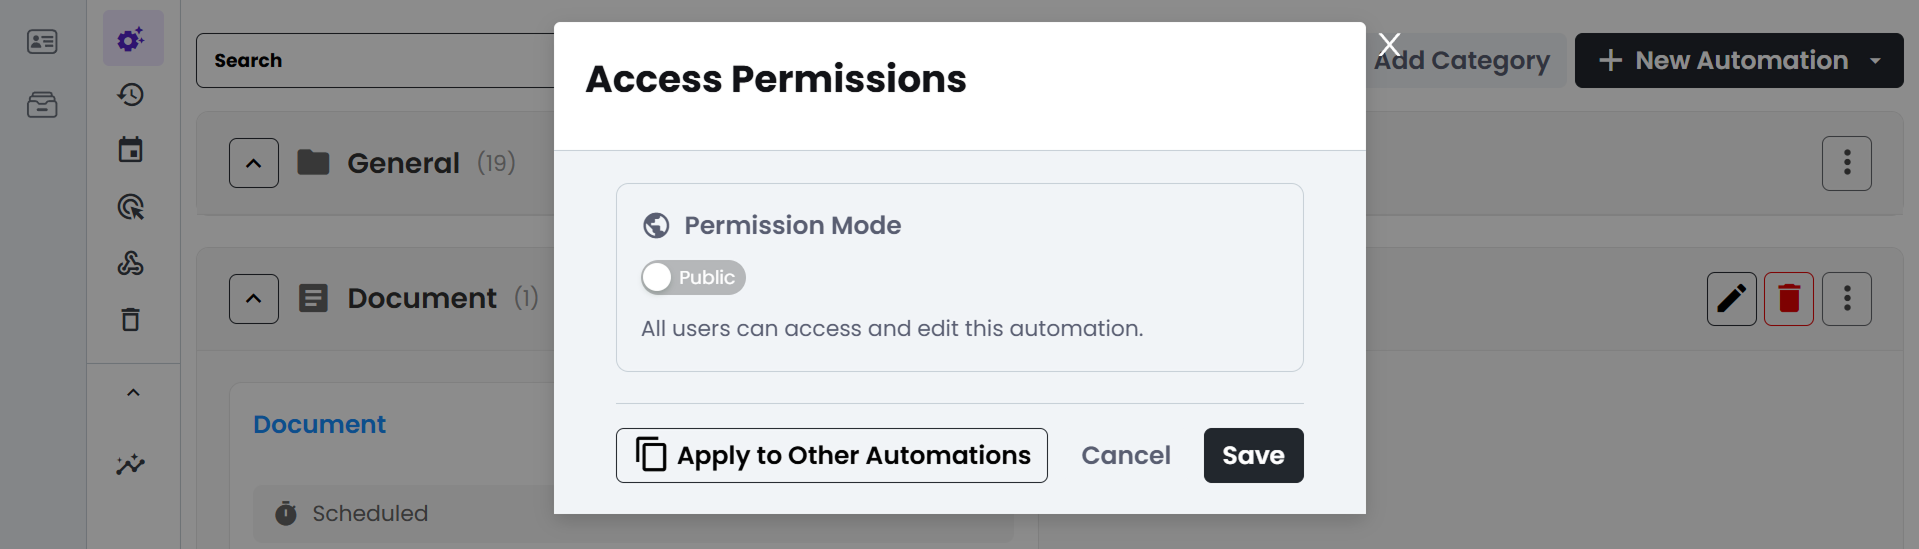
c. Automation Access Permissions
It is the authorization area where you determine which users or teams in the system can view and edit this automation.
d. Edit Description
It allows you to update the description text written about what the automation does when creating the automation.
e. Change Automation Category
It allows you to move the relevant automation from its current folder to another category.
f. Delete Automation
It sends the selected automation to the trash area in the automations menu.
4. Automation Message Deliveries and Live Traceability
To increase the traceability of messages delivered to customers by automation scenarios, live redirection links have been added directly to the chat window:
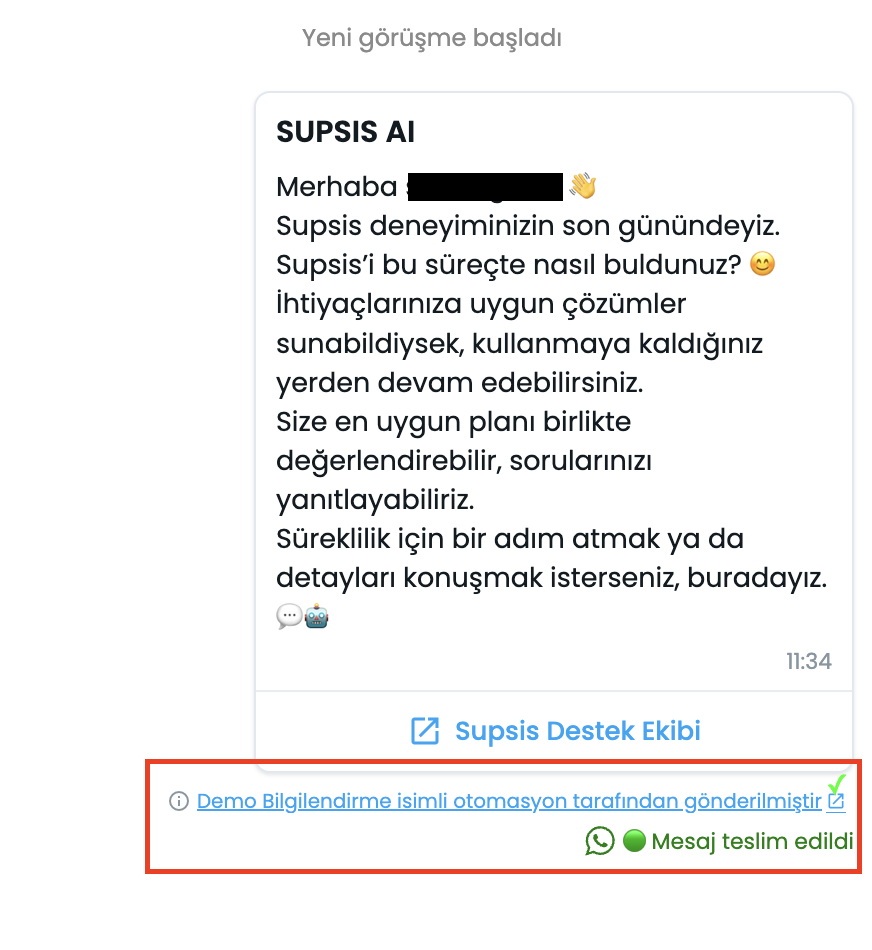
- Automation Notification Tag: Below messages sent via automation (WhatsApp, Chatbot, etc.), an "ℹ️ Sent by automation named [Automation Name]" tag is displayed.
- Direct Link from Chat to Automation: When agents or managers click this tag during a conversation, they are immediately redirected to the edit page of the specific automation that triggered the message.