
Through the automation content area, you can manage test and automation content creation processes in detail. All the tools you need while designing and editing your automation scenarios are gathered on this screen.
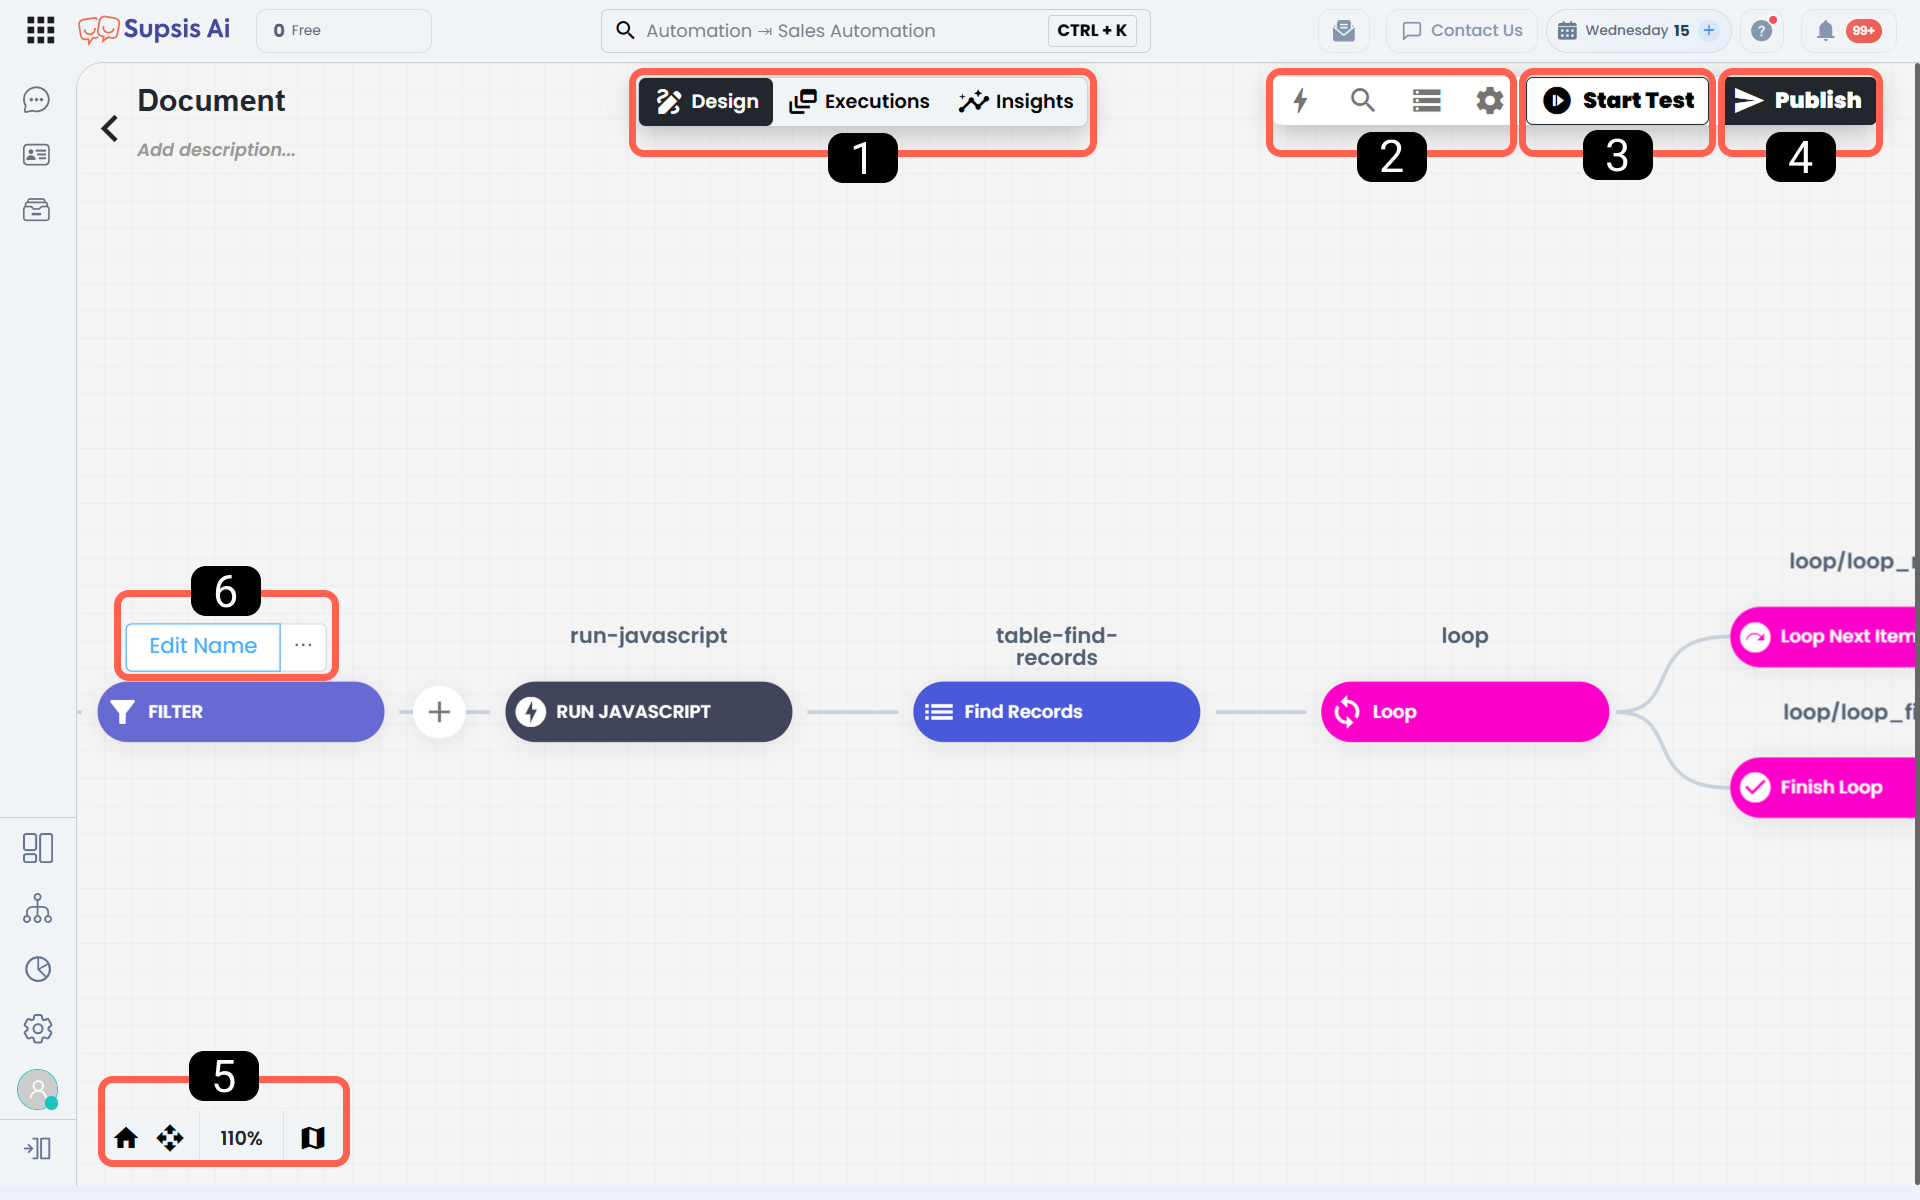
| No | Menü |
|---|---|
| 1 | Automation Menus |
| 2 | Design (Diagram) Operations |
| 3 | Test Automation |
| 4 | Publish |
| 5 | Navigation Elements |
| 6 | Block Operations |
1. Automation Menus
This area is the top menu group where you can control the planning and detailed analysis of the automation you designed.

1.a – Design
It is the main workspace where you construct the automation workflow (diagram) as visual blocks.
1.b – Execution Plan and Task History
It is the administration tab where you can access the detailed breakdown of the automation plan and all triggered task execution histories.
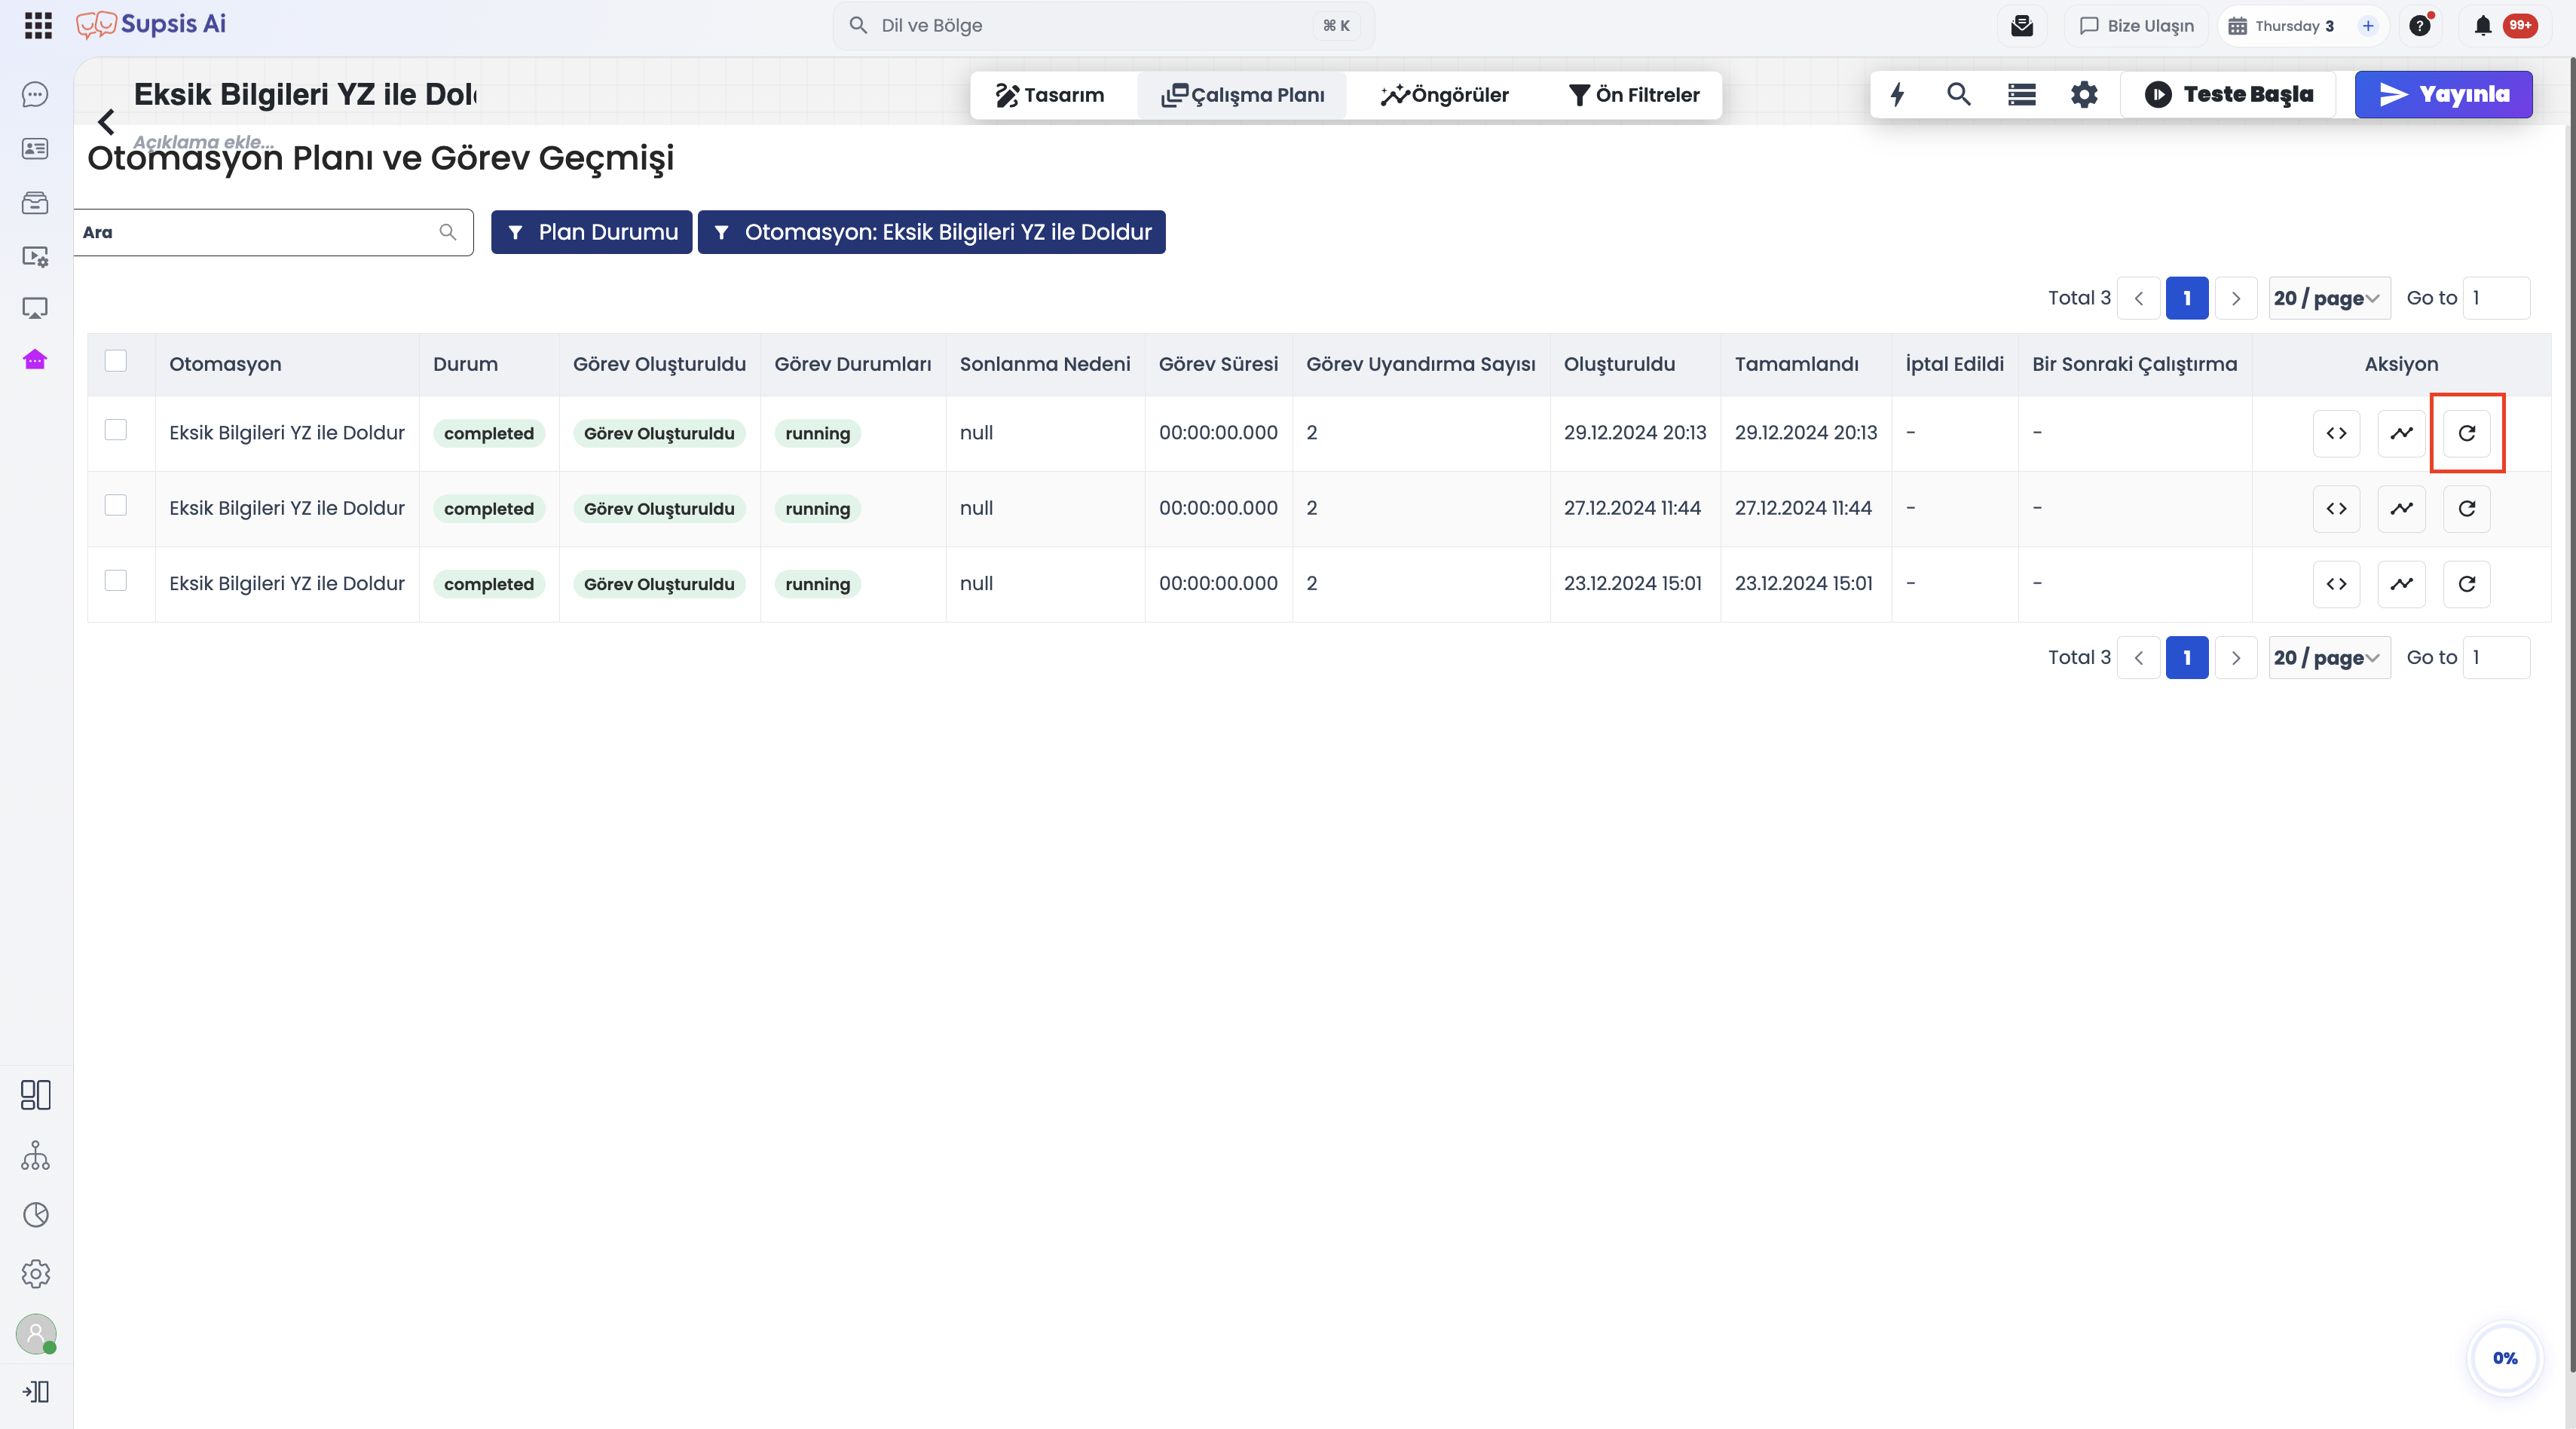
The metrics and table columns you can track on this screen are as follows:
- a. Automation: Displays the name of the automation whose plan content you are inspecting.
- b. Status: Shows the overall task execution state (e.g.,
completed,failed). - c. Task Created: Indicates the creation status of the task in the queue.
- d. Task Status: Represents the real-time operational phase of the task (e.g.,
running,finished). - e. Termination Reason: Specifies the termination condition or block output message indicating where and why the flow concluded.
- f. Task Duration: Measures the precise runtime between task start and completion in milliseconds.
- g. Task Wake Count: Displays how many times the task was resumed within its lifecycle.
- h. Created: The initial timestamp when the automation flow was triggered.
- i. Completed: The timestamp when the automation reached its terminal state.
- j. Canceled: Details the cancellation reason if aborted manually or systemically.
- k. Next Run: If a Sleep/Wait block is present, shows the upcoming scheduled resume time.
- l. Action: Operational tools available per task row:
- View Payload (
<>): Opens the initial input JSON payload that initiated the task. - View Execution Flow: Inspects block progression charts and debugging paths.
- Retry (
⟳): Re-runs the exact automation task using the identical input payload.
- View Payload (
Retry (Re-run) Mechanism in Automations
A single-click Retry mechanism has been integrated into the Execution Plan table across all Event-Based and Button-Based automation workflows system-wide.
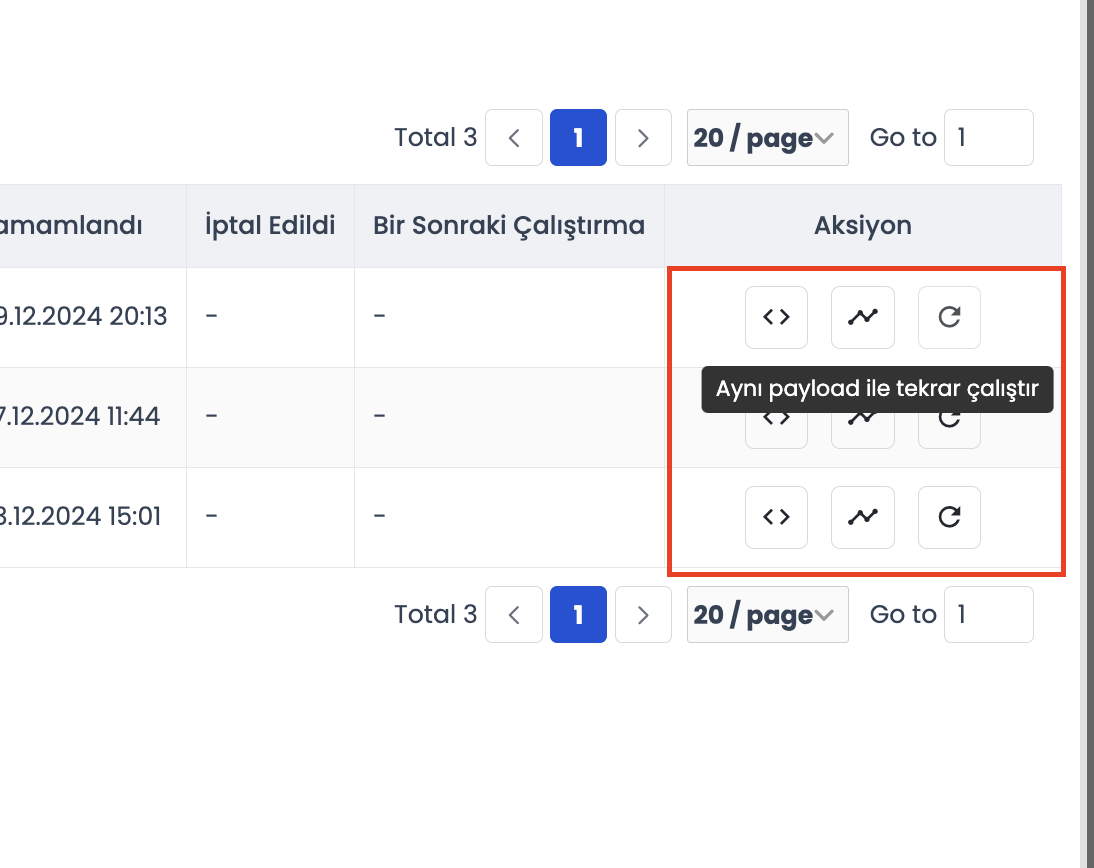
How the Retry Mechanism Works & Key Benefits
- Identical Payload Execution: Clicking the retry button creates a brand-new task instance using the exact same input payload (user parameters, form inputs, webhook body) captured during the original execution.
- Elimination of Manual Re-triggering: If a temporary connection drop, third-party API outage, or timeout caused a task to fail, administrators no longer need to ask the client to re-submit forms or re-click buttons.
- Accelerated Troubleshooting: Engineering and support teams can patch a broken diagram block and immediately test resolution by re-running historical tasks with a single click.
Step-by-Step: Re-running a Task via Retry
- Access the Execution Plan:
- 1.a- In the automation designer, switch to the Execution Plan (Çalışma Planı) tab in the top navigation bar.
- 1.b- Locate the desired historical task in the execution list.
- Trigger the Retry:
- 2.a- Hover over the circular reload icon (
⟳) located in the Action (Aksiyon) column on the right. - 2.b- Verify the "Aynı payload ile tekrar çalıştır" (Re-run with the same payload) tooltip.
- 2.c- Click the icon to immediately dispatch a new task instance with identical parameters.
- 2.a- Hover over the circular reload icon (
Use Cases & Key Advantages
| Scenario | Previous Approach | With Retry Mechanism |
|---|---|---|
| Temporary API Downtime | Required asking visitors to re-trigger the event. | Admins hit Retry in the execution table to instantly complete the flow. |
| Testing Diagram Fixes | Required sending fake webhook requests from external tools. | Re-runs authentic customer payloads against the updated workflow in 1 second. |
| Recovering Failed Tasks | Required copying and pasting raw JSON parameters manually. | Dispatches fresh runs preserving original input hygiene automatically. |
Preserving History
Retrying a task does not overwrite the original run. A new historical row is appended to ensure full auditability.
Global Availability
The retry mechanism is accessible on all event-based, button-based, and webhook automations across the entire platform.
1.c – Insights
Opens the analyses (statistics) related to the automation. For more information, see: Analysis (Statistics)
1.d – Not Available Here
a. Scheduled Automation Scheduler
Scheduled automations run automatically according to the periods and specific time intervals you define within the automation content. When a scheduled automation is created, you can access the Scheduler from this area and define an execution plan with up to 1000 repetitions. (see: Scheduled Automations)
b. Webhook Menu
Webhook automations are triggered by HTTP requests sent from external systems to the Supsis AI automation URL. In a webhook-type automation, you can additionally access the automation Webhook menu from this area. (see: Webhook Automations)
2. Design (Diagram) Operations
It contains the basic configuration tools and functions within the automation scenario diagram.

2.a – Automation Blocks
Automation Blocks are the basic building blocks that create the automation scenario. Through this area, you can build different diagram flows with different block elements, create directions according to the returned data inputs, and add the interactions you need to the diagram with drag-and-drop logic.
For more information about automation blocks, see: Automation Blocks
2.b – Search Block
The Search Block area allows you to quickly access a specific block you are looking for within the automation flow. Especially in complex scenarios containing many blocks, you can directly access the relevant step by typing the name of the block you are looking for and speed up the editing process..
2.c – Cache Management
The Cache Management area supports managing temporary data to be used between automation and chatbot scenarios. Thanks to this structure, data such as session information and preferences belonging to the user; data that the automation needs to associate with the user for a short time can be stored securely and reused within the flow.
2.d – Automation Settings
It is the dropdown menu where the technical settings of the automation flow and export options are located.![]
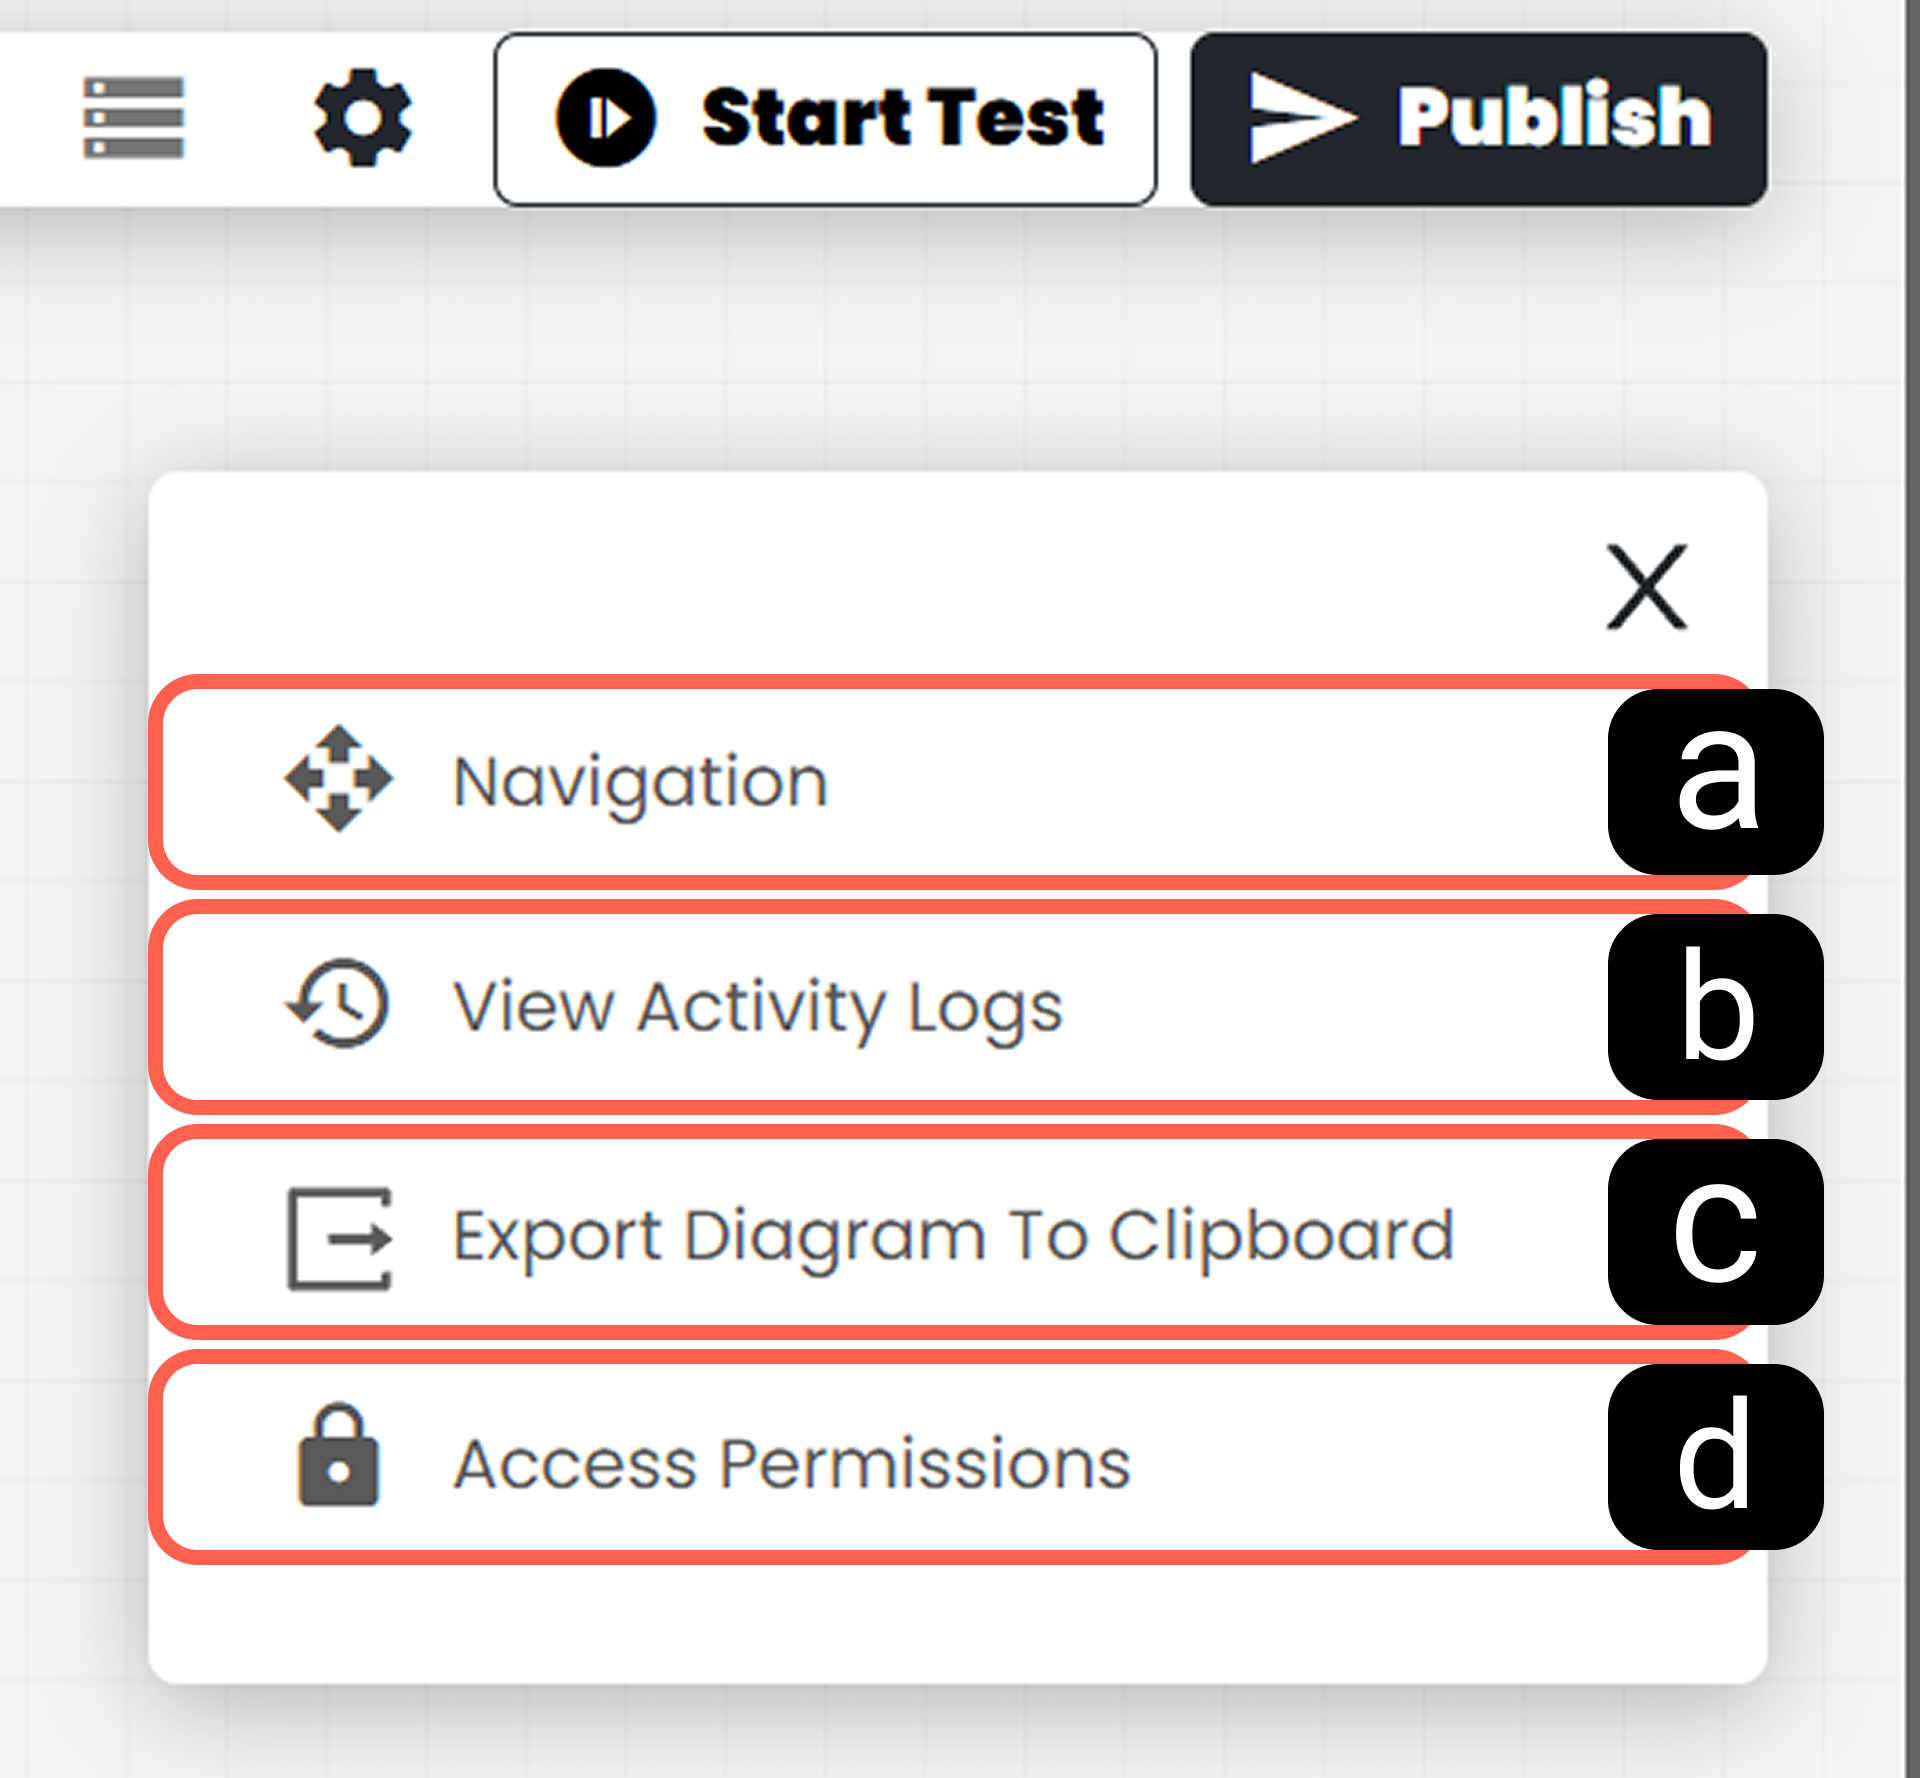
a. Navigation
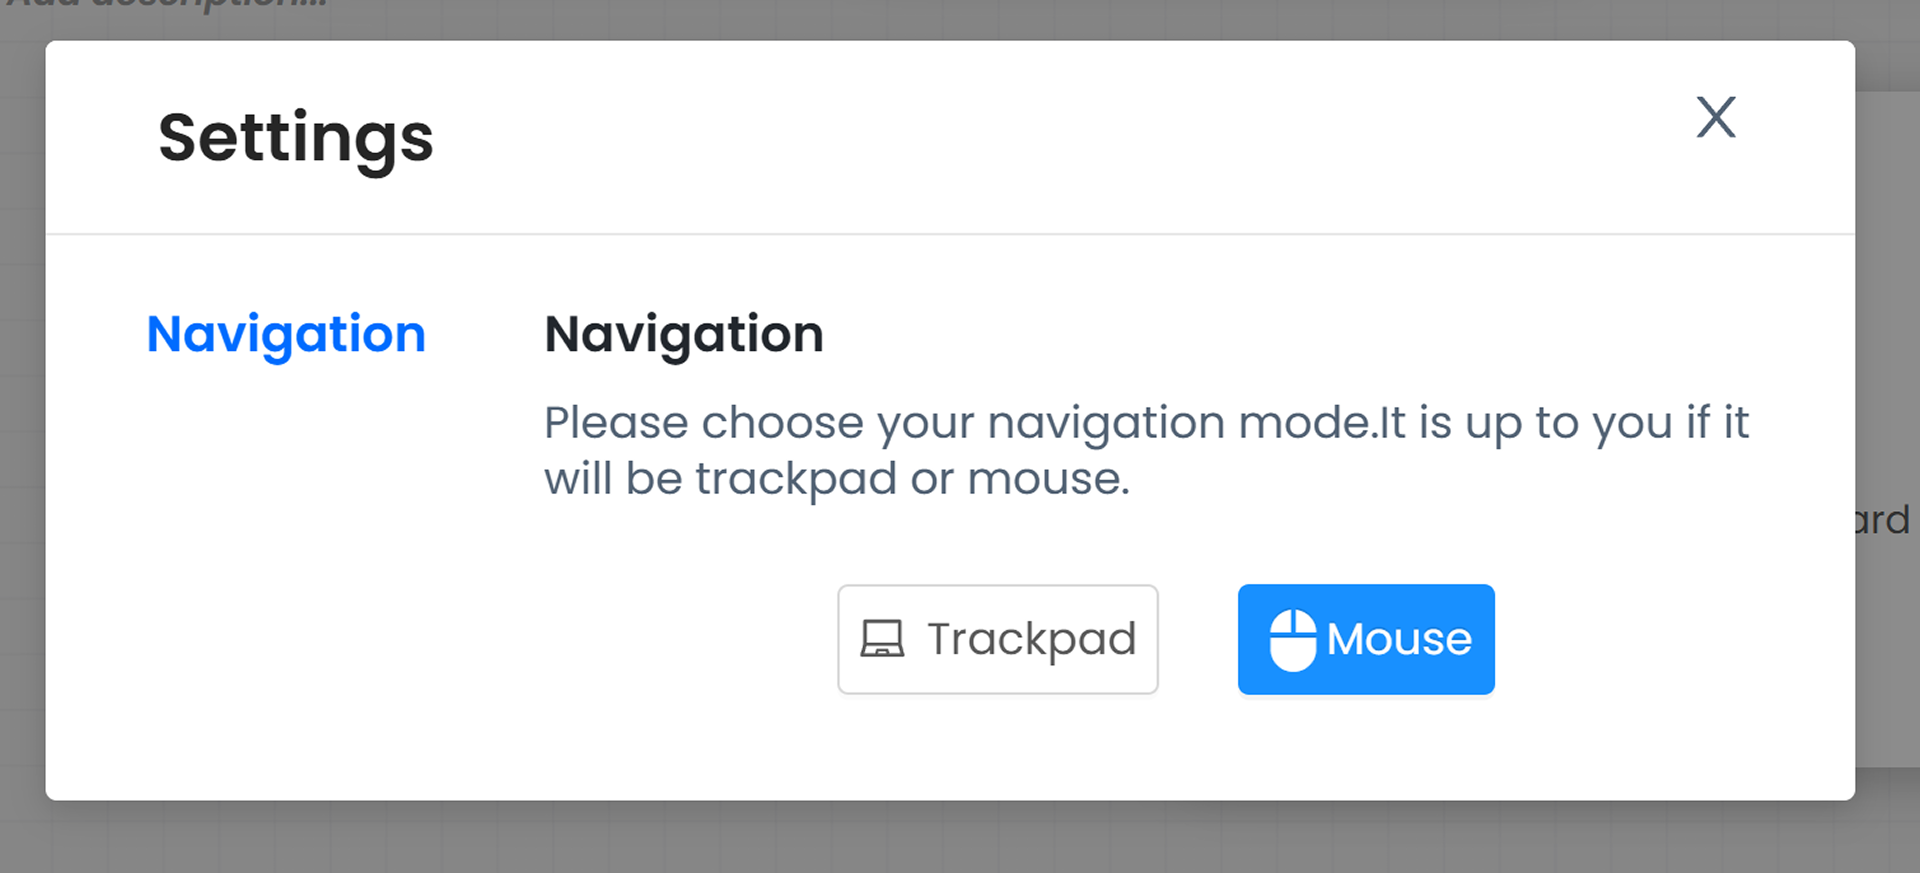
It allows you to personalize the scrolling/zooming dynamics (your navigation mode) on the screen according to your trackpad or mouse usage.
b. View Activity Logs
It allows you to access the record history of the operations and structural changes made by users in the Supsis AI panel on this automation.
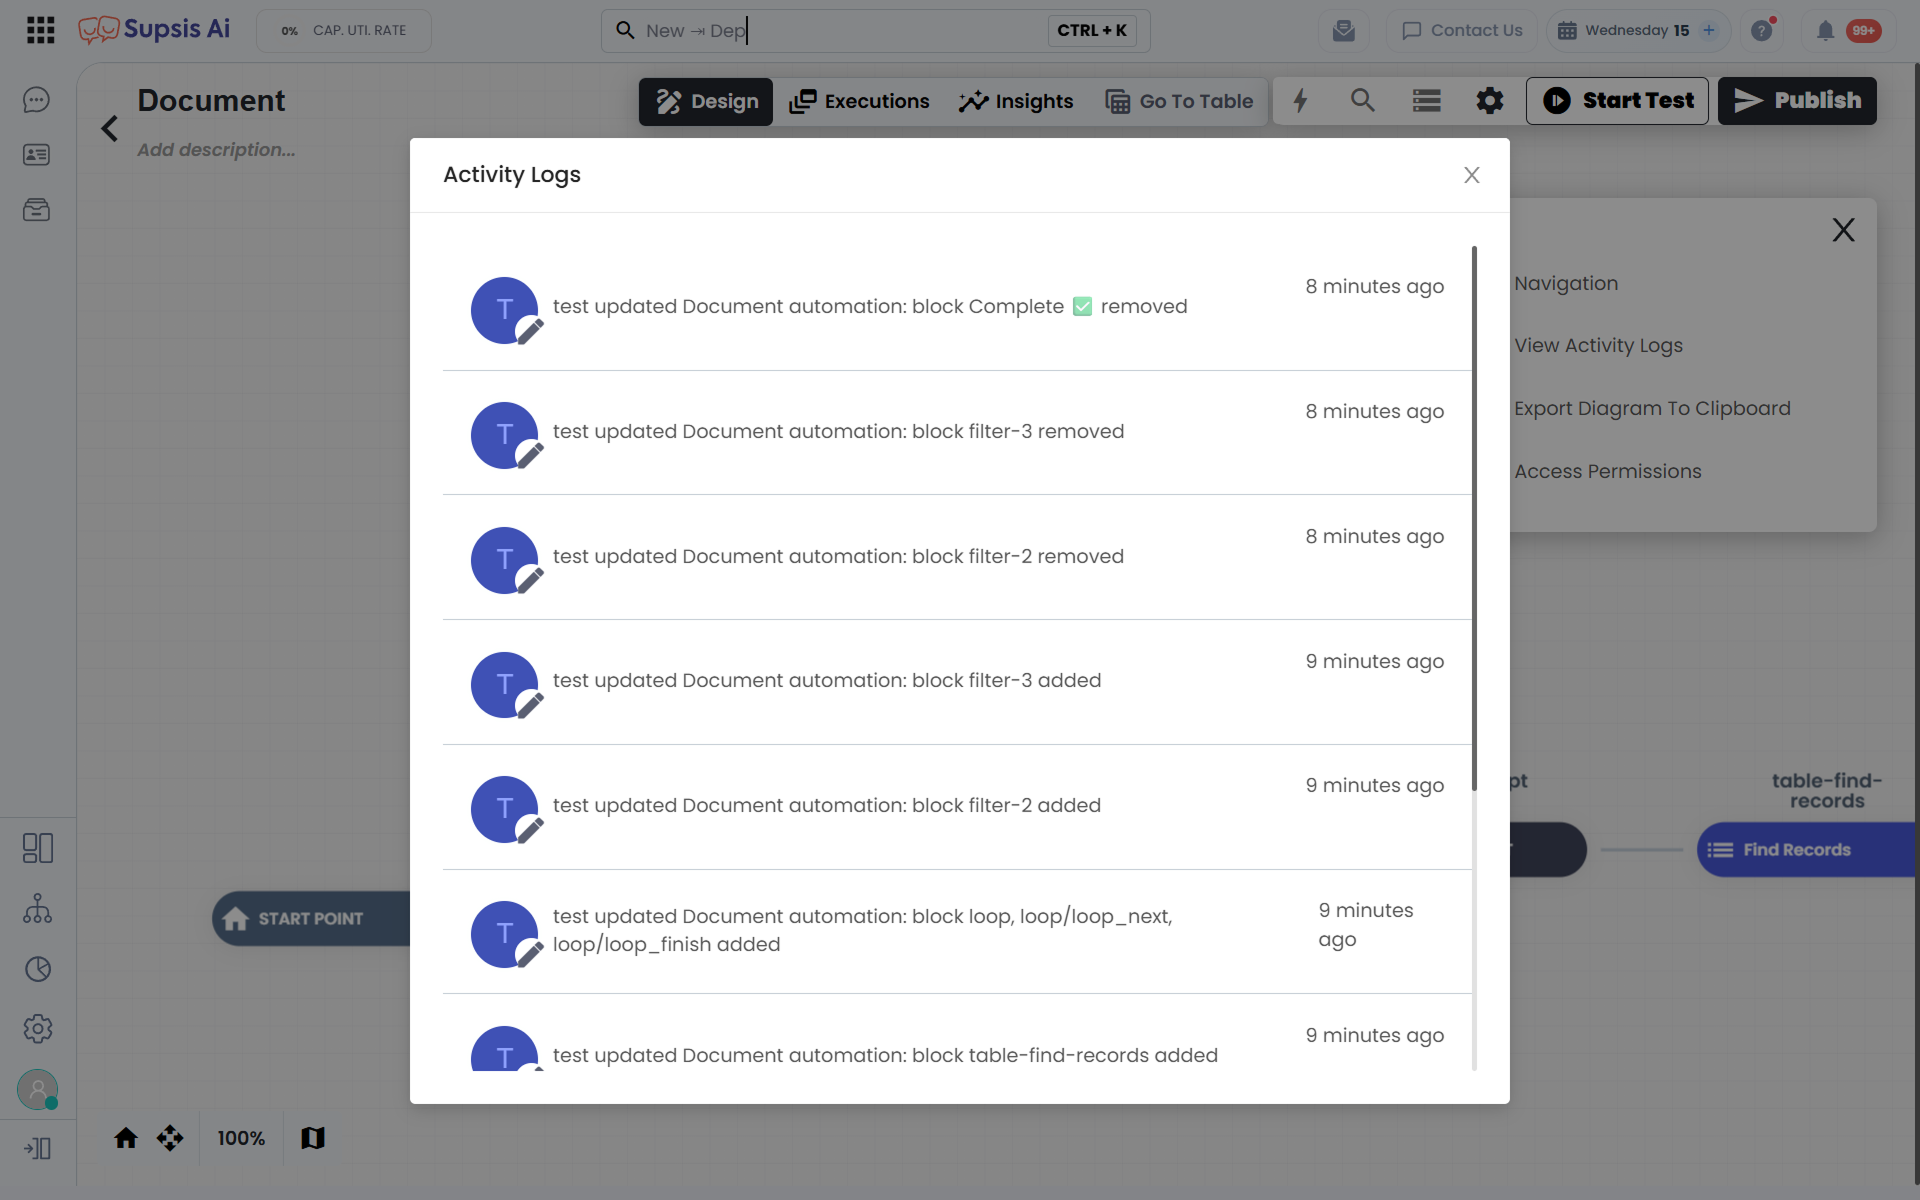
Each change made is listed on a daily basis; thus, you can transparently track the development process of the scenario.
c. Copy Diagram to Clipboard
Copies the structural data (in JSON format) of the current automation design to your computer’s clipboard. This operation is used to export the automation, back it up, or quickly transfer it to another Supsis AI panel.
d. Access Permissions
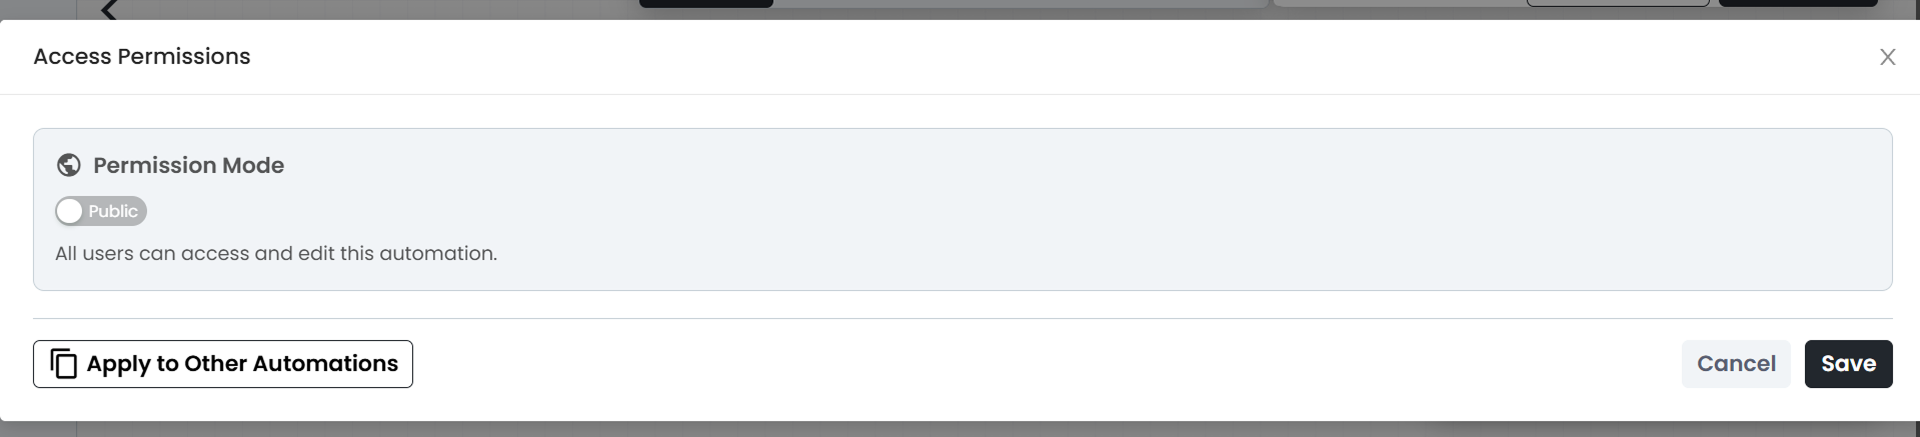
It is the security and authorization setting where you determine which users, teams, or departments in your system can view and edit this automation.
3. Test Automation
The test feature allows you to test the automation you created in a simulation environment before publishing (going live). This test environment enables you to see step by step how sample data coming from outside or the system is processed by the blocks. You can instantly view the raw data (input) received by the relevant block and the output it produces after processing.
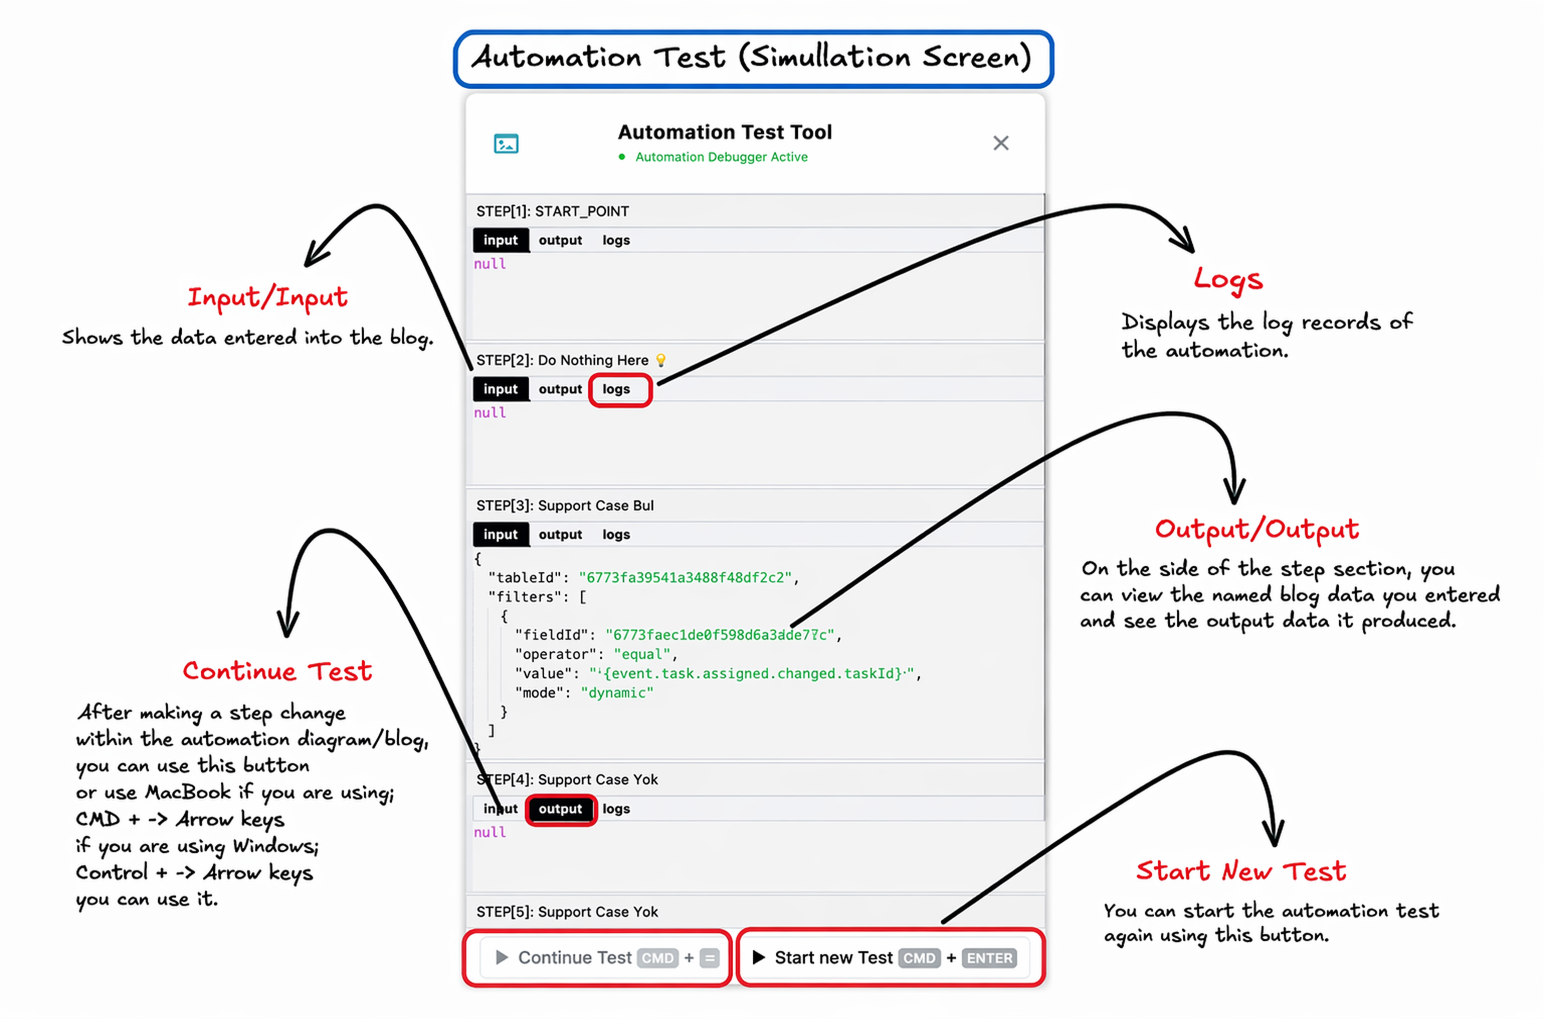
Note: Although the test environment has the same operating logic as the live environment, it may differ from the live environment depending on the data flowing within it.
4. Publish
It is the button that allows you to activate the automation scenario you have prepared, edited, or successfully tested by saving it. After the "Publish" process, your automation is transferred to the live environment and starts running in the system according to the triggers you defined (time, event, webhook, etc.).
5. Navigation Elements
They are visual interface tools that allow you to navigate comfortably on the diagram screen (workspace) and control the scenario design in detail.
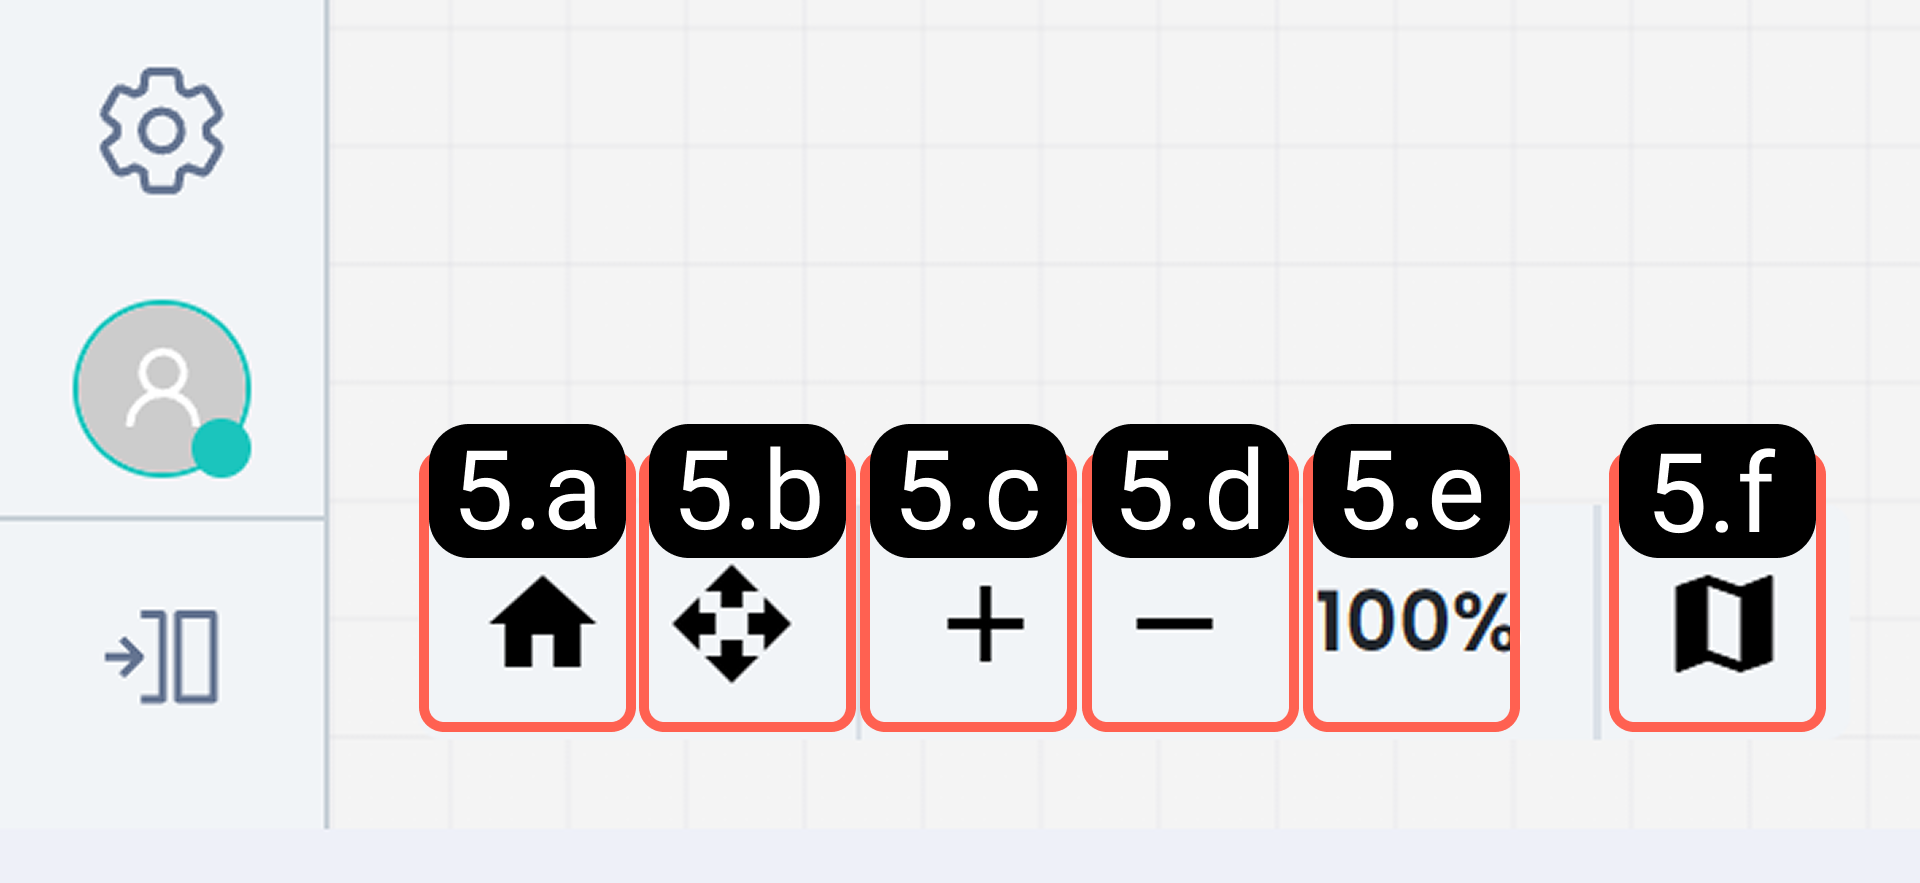
5.a – Return to Start Point: This button takes you to the very first step where the scenario starts (is triggered). While working in distant corners or different sections of the diagram, you can use it to return to the start of the main flow with a single click.
5.b – Full Screen: Allows you to view the automation scenario in a wider workspace in your browser. Especially in complex scenarios with dense block structures, it helps you enlarge the screen to review, edit, and focus on the flow more comfortably.
5.c – Zoom In: Allows you to view the blocks and texts in the diagram on a larger scale (zoom-in).
5.d – Zoom Out: Reduces the view so that you can see a larger part of the diagram at once (zoom-out). It is especially used in scenarios with many blocks to track relationships between blocks and to have a full overview of the flow.
5.e – Zoom Level & Reset Zoom: It is the button that shows your current zoom level (e.g.: 120%) and resets this level to the default standard setting of 100% when clicked. It is very functional for quickly balancing the view.
5.f – Decision Tree Map (Mini Map): It is a helper map that shows the overall layout of the automation scenario from a bird’s-eye view in a corner of the screen. Especially in long and highly branched flows, it allows you to easily understand where you are in the diagram and instantly jump (quickly position) to different sections by clicking on the map.
6. Block Operations
It is the section that covers specific editing, copying, and management operations that you can perform on the automation blocks you added to your diagram. Thanks to these tools, you can gain speed while designing complex scenarios and keep your workspace more organized.
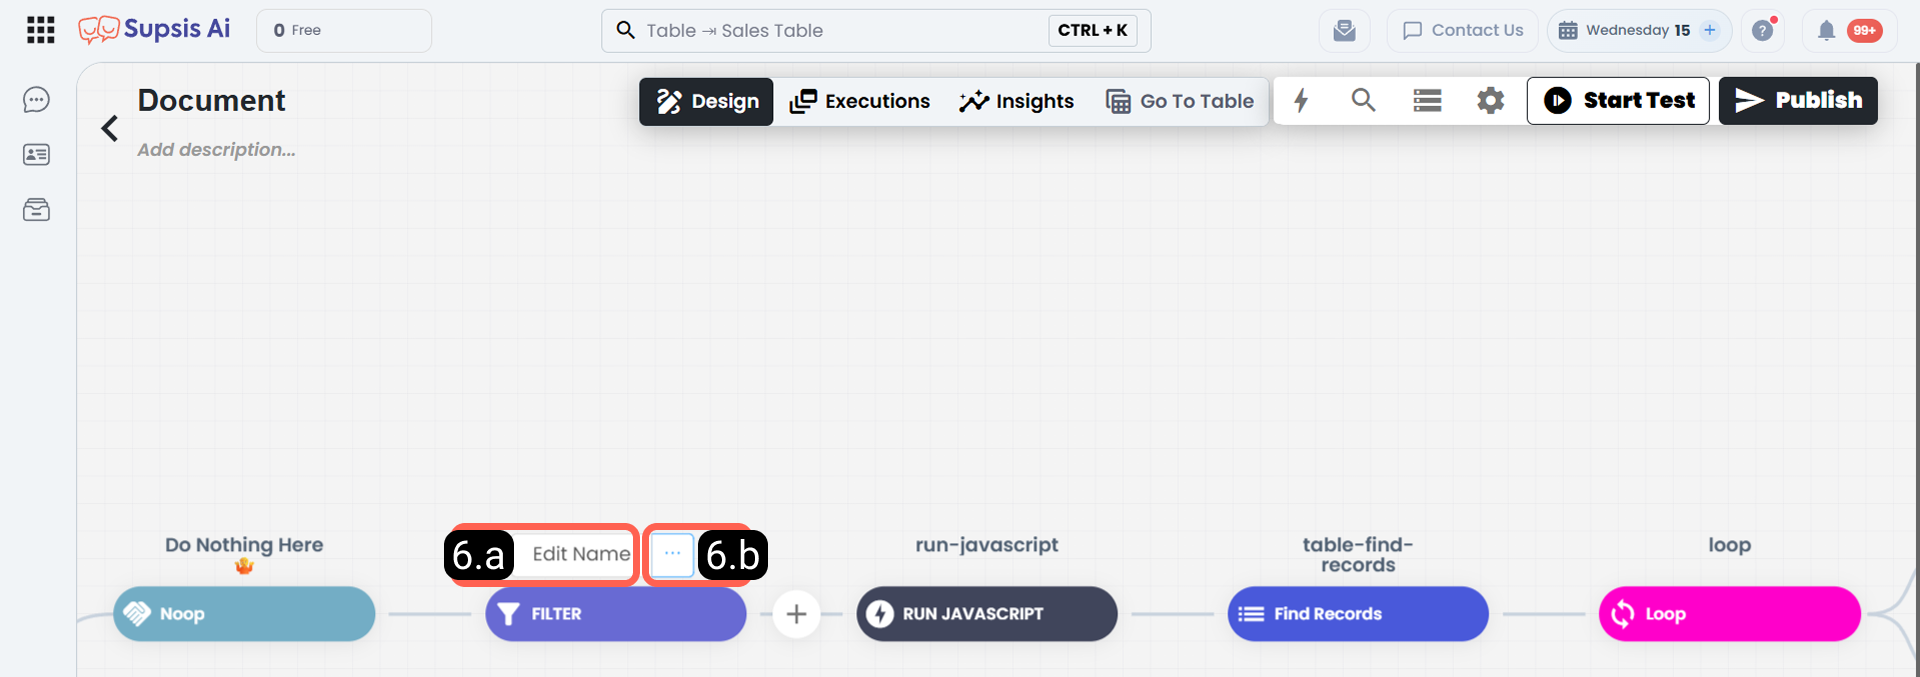
6.a – Edit Block Name
By clicking the edit button on the title part of the block, it allows you to change the name of the relevant block according to your own workflow logic. Especially in long and complex scenarios where multiple blocks of the same type are used (e.g.: multiple Webhook or Filter blocks), giving each one custom names that describe the specific function it performs (for example: "Fetch Customer Data" or "Payment Record Byl") greatly facilitates the readability of the automation flow.
6.b – Block Operations
It is the management menu that opens when you click the three dots (...) icon in the upper right corner of the relevant block. It allows you to perform the following quick actions on the selected block.
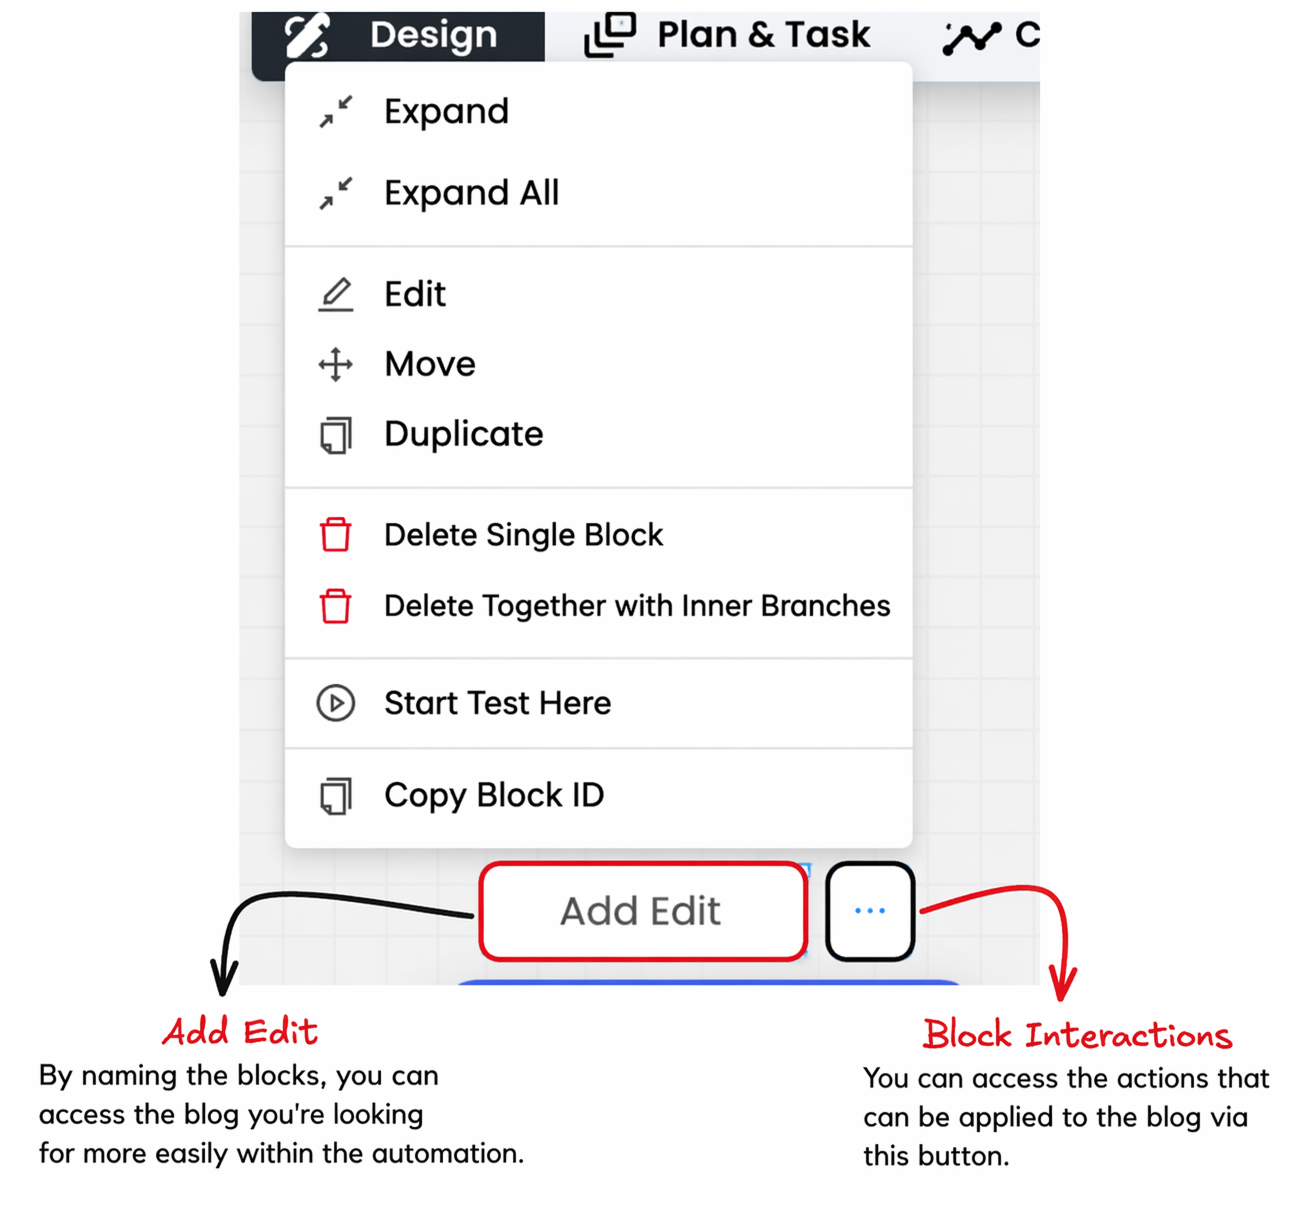
Collapse: Collapses the block and the flow behind the block. The collapse interaction only collapses the block you performed the action on.
Collapse All: Collapses all blocks in the flow behind the block you performed the action on.
Edit: Opens the screen where you will edit the action content of the block. You can access this screen both from the edit button here and by clicking directly on the relevant block.
Move: Allows you to move the block and the entire flow behind it within the diagram you are designing.
Copy: Allows you to copy the block and the entire flow behind it to any area you want within the diagram you are designing. This interaction will also dynamically bring the data inside the block.
Delete Single Block: Deletes only the block you performed the action on.
Delete with Sub-Branches: Deletes the block you performed the action on and all blocks in the flow behind it.
Start Test from Here: Starts the test/simulation screen from the block you performed the action on.
Copy Block ID: Copies the ID of the block you performed the action on. Through the ID you copied, you can read the data held by the block and perform step navigation functions.