
2. Report Menu Content
The report menu is the main control bar that allows you to customize, filter, and export the data in the report type you selected. Through this menu, you can narrow down the data in the system according to specific date ranges, customer representatives, or specific communication channels and reach exactly the analyses you are looking for. At the same time, you can determine whether the data will be presented on the screen as a visual chart or as a detailed table, and you can download these analyses you have prepared to your device for archiving or presentation purposes.
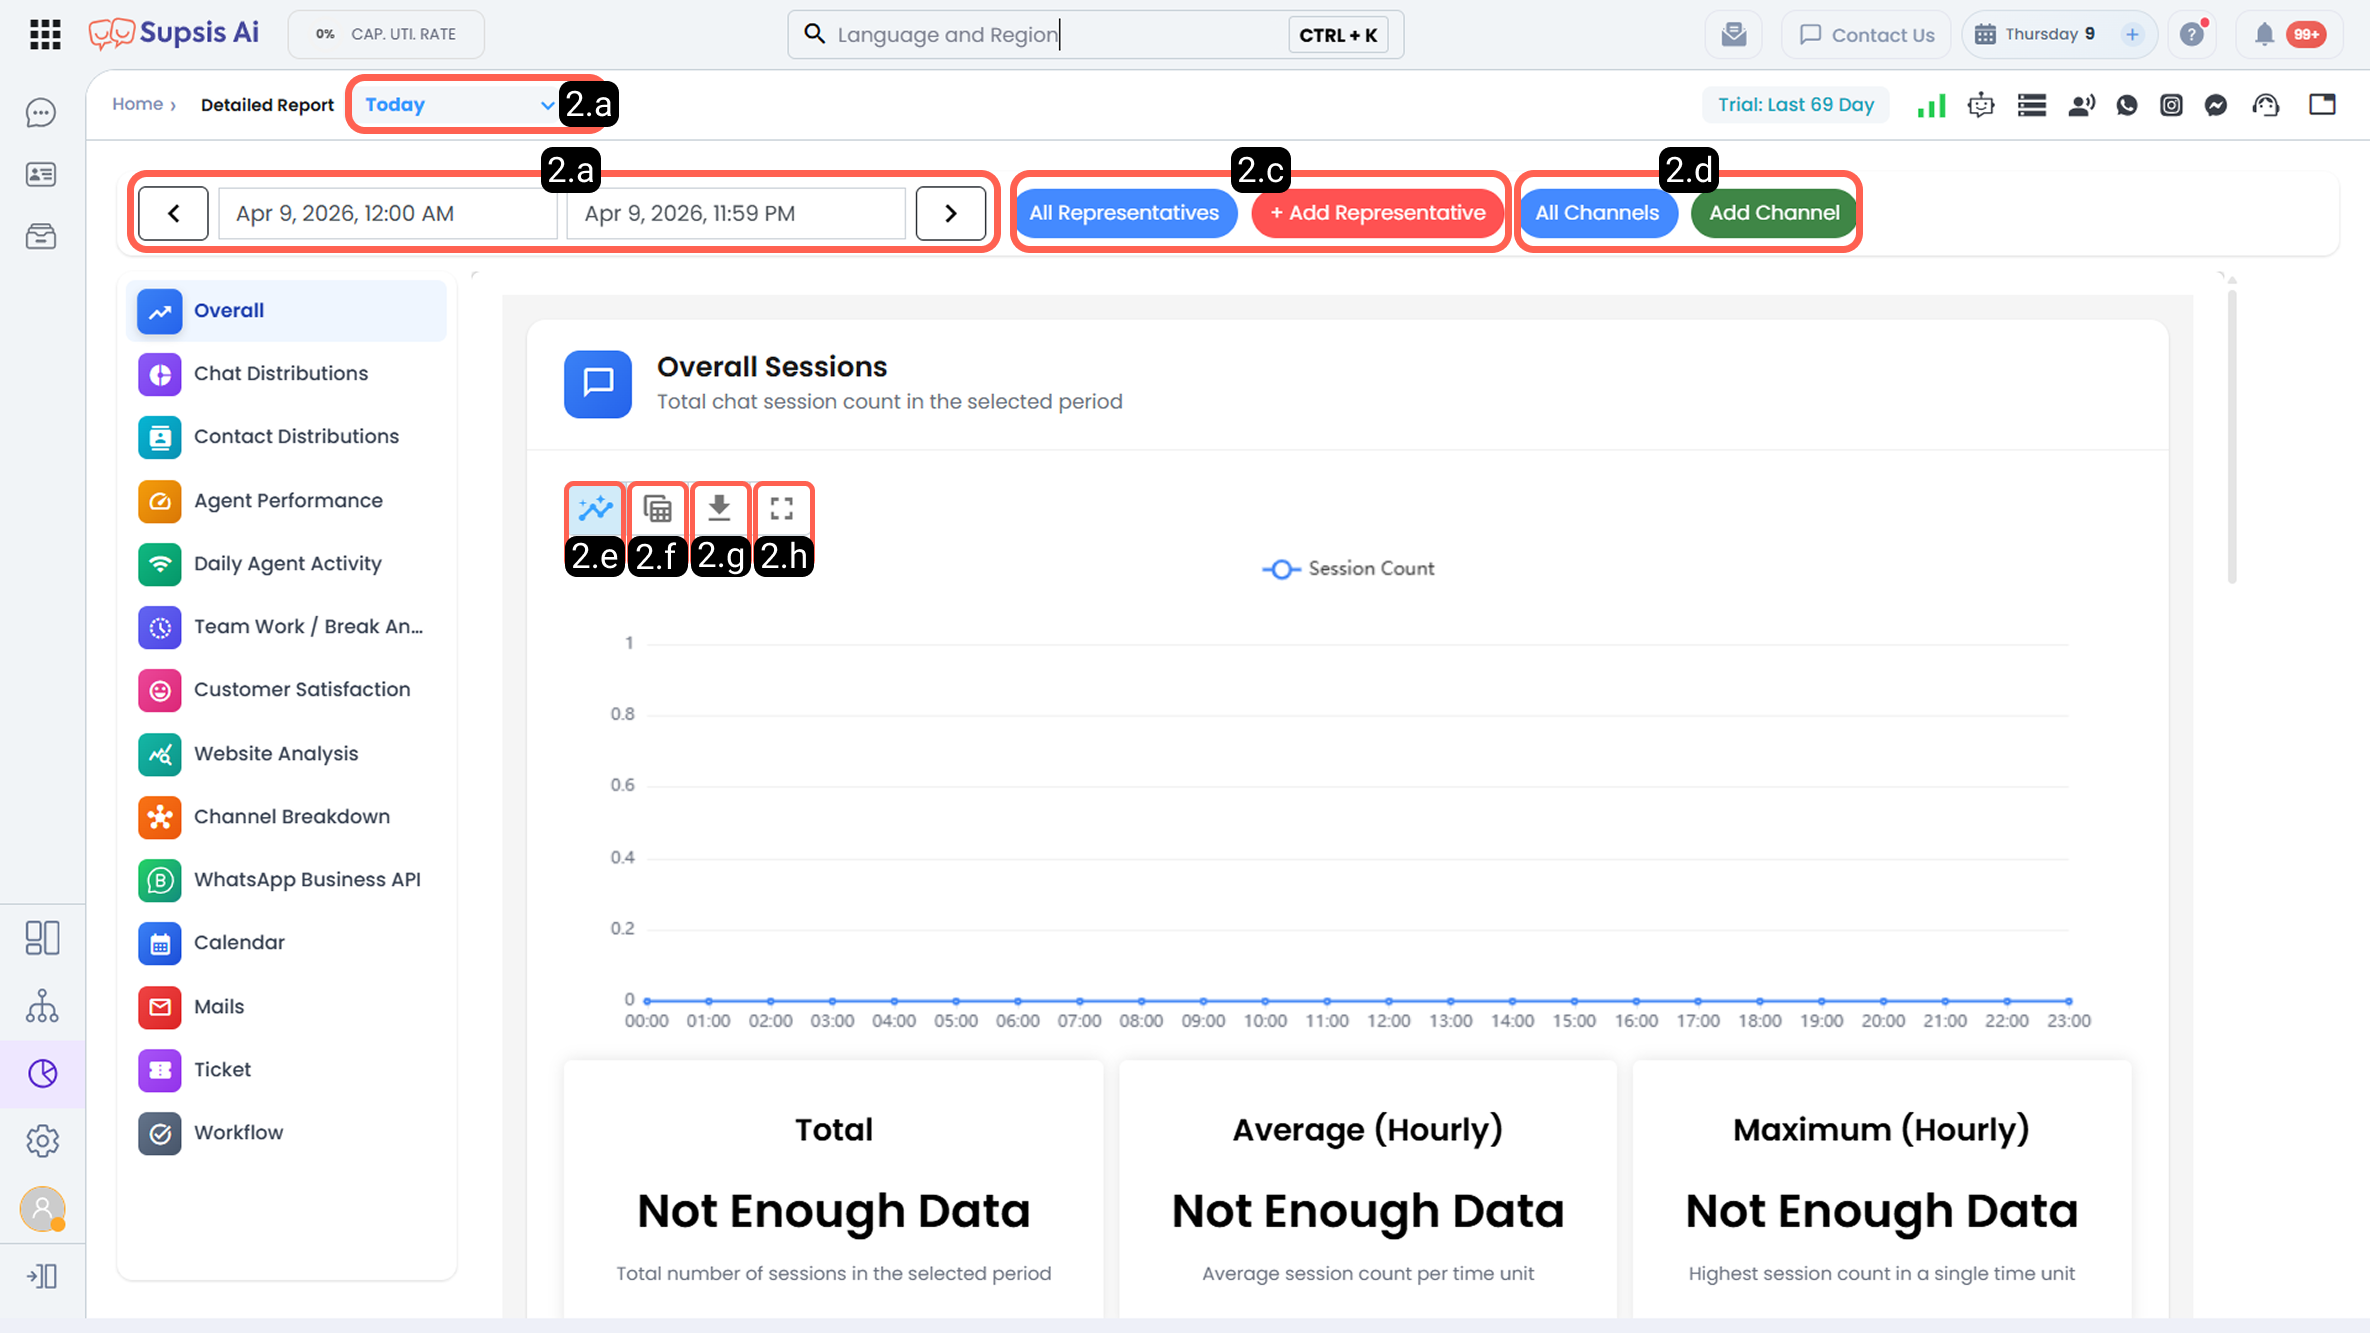
2.a – Report Day Selection
This tool allows you to quickly filter the data through predefined time periods such as daily, weekly, monthly, or yearly.
2.b – Report Time Range
If you want to perform a more specific date analysis, you can use this section to define a custom start and end date and analyze only the interactions between those selected dates.
2.c – Representative Filter
This field, which is offered to narrow down the report and separate it by personnel, allows you to list only the metrics belonging to specific customer representatives or teams you selected instead of the general data in the system.
2.d – Channel Filter
This filter allows you to perform source-based performance analysis by isolating the data according to specific communication channels such as WhatsApp, Instagram, or Messenger.
2.e – Chart View
This option, which determines how the report results will be displayed on the screen, ensures that numerical data is presented in more easily understandable visual charts (pie, line, or bar charts) and helps to quickly read general trends.
2.f – Table View
You can use this option when you want to examine the data in detailed rows and columns with clear numbers instead of superficial charts.
2.g – Download Report in Excel Format
In order to use the analyses you created and filtered on the screen in external company presentations or to archive them, you can save the data to your computer as a spreadsheet file (.xlsx) by clicking this button.
2.h – Full Screen
If you want to create a more comfortable and focused review area in detailed reports with a large amount of data, you can use this button to expand the report panel to cover the entire screen of your browser.