Ticket Reports
Ticket Reports, This section allows you to view detailed reports about all tickets created in the system. By analyzing various metrics such as incoming ticket counts, response statuses, and ticket distribution by representatives, it enables you to manage your support processes more efficiently. This way, you can track how quickly and effectively customer requests are resolved, evaluate your team's performance, and make necessary improvements.
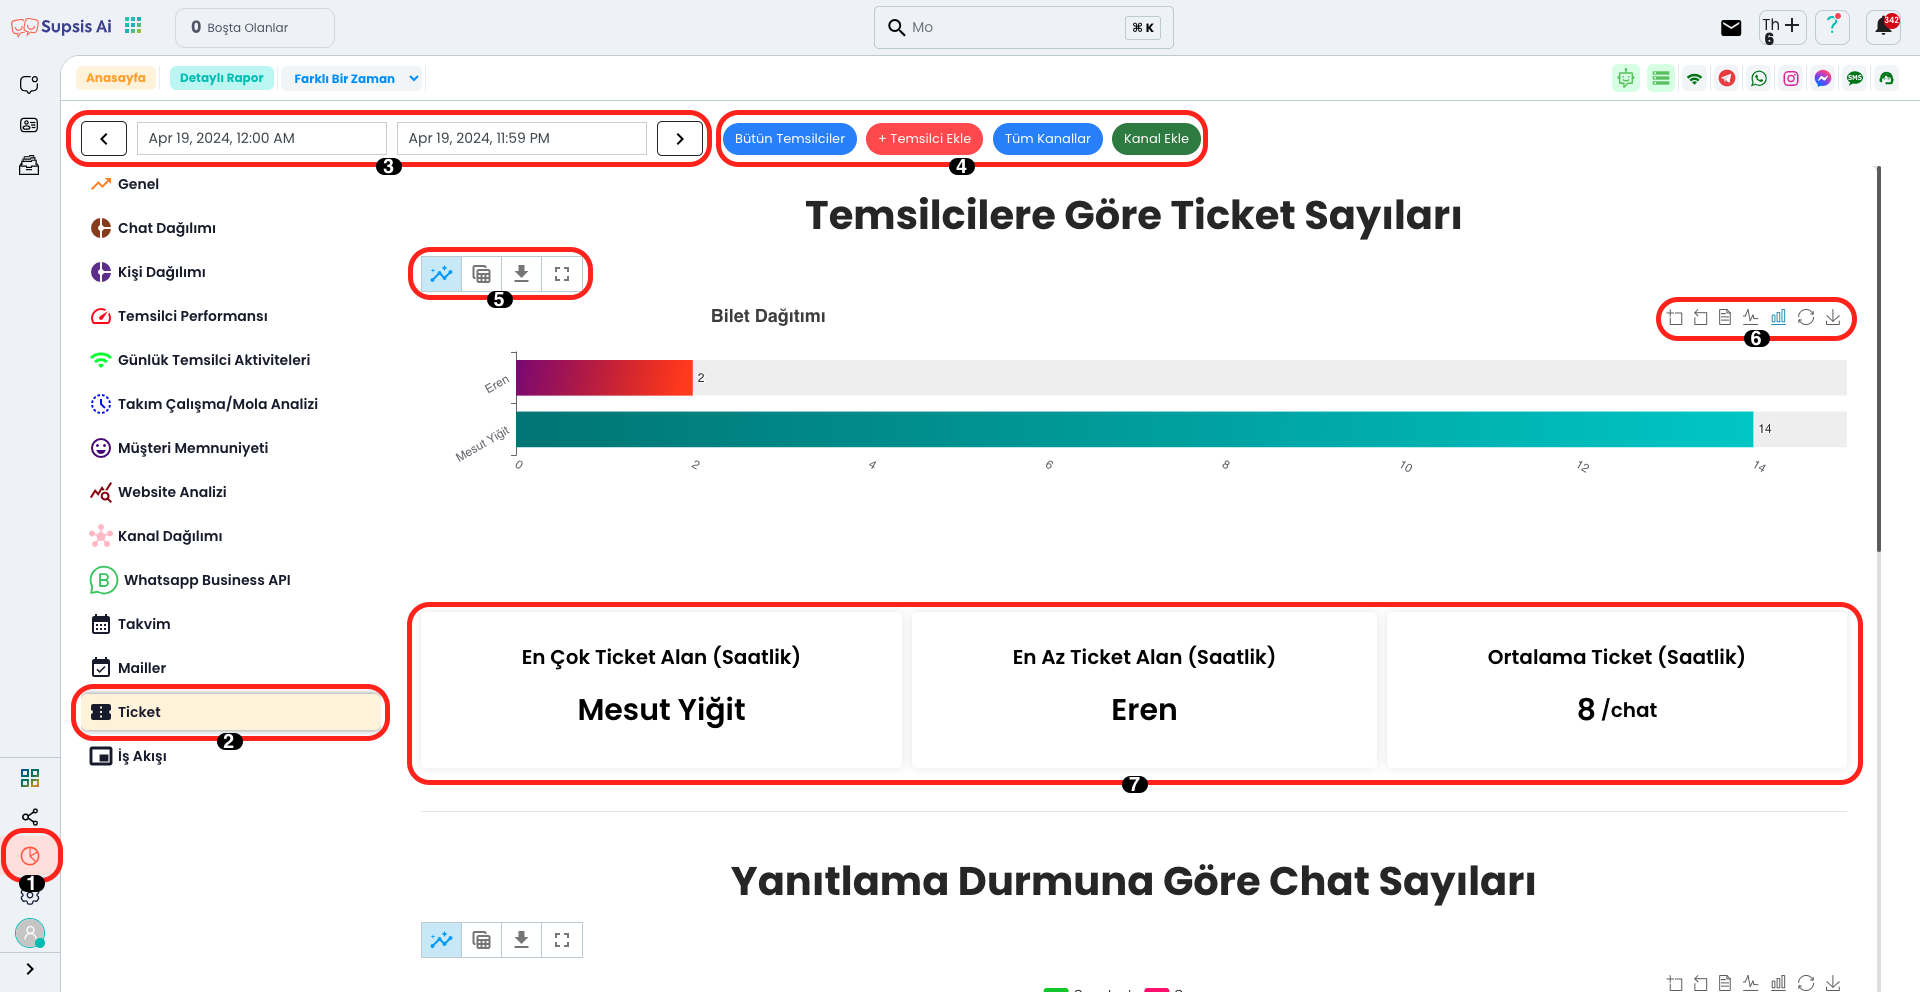
Click on the Reports icon in the left menu. You can access the Ticket Reports page by selecting the Ticket option from the opened submenu. On this page, you can view and analyze detailed reports about tickets created in the system.
Ticket Reports Elements:
- Reports
- Ticket Reports
- Report Dates
- Add Representative-Channel
- Report View
- Report Format and Import
- Report Statistics
1.) Reports
The Reports Module allows you to view in detail the statistics and data from all modules in your system. By analyzing a wide range of data from user interactions to operational performance, you can manage your business processes more efficiently and shape your strategic decisions based on data.
2.) Ticket Reports
This area allows you to view reports containing general data and statistics related only to the Ticket Module. Through these reports, you can analyze many metrics such as ticket counts by representatives, chat response statuses, and average ticket counts in detail. This way, you can manage your support processes more effectively, evaluate your customer service performance, and identify areas for improvement.
3.) Report Dates
This area allows you to view reports between specific dates. By selecting the relevant date range, you can filter and analyze ticket data for the specified time period. This way, you can compare past period performances and examine the changes in your support processes over time.
4.) Add Representative-Channel
In this section, you can add new representatives to your support team or define new communication channels. You can add a new representative to the system using the "Add Representative" button, and include different communication channels in the system using the "Add Channel" button. This feature allows you to make your customer support processes more efficient and expand your team as needed.
5.) Report View
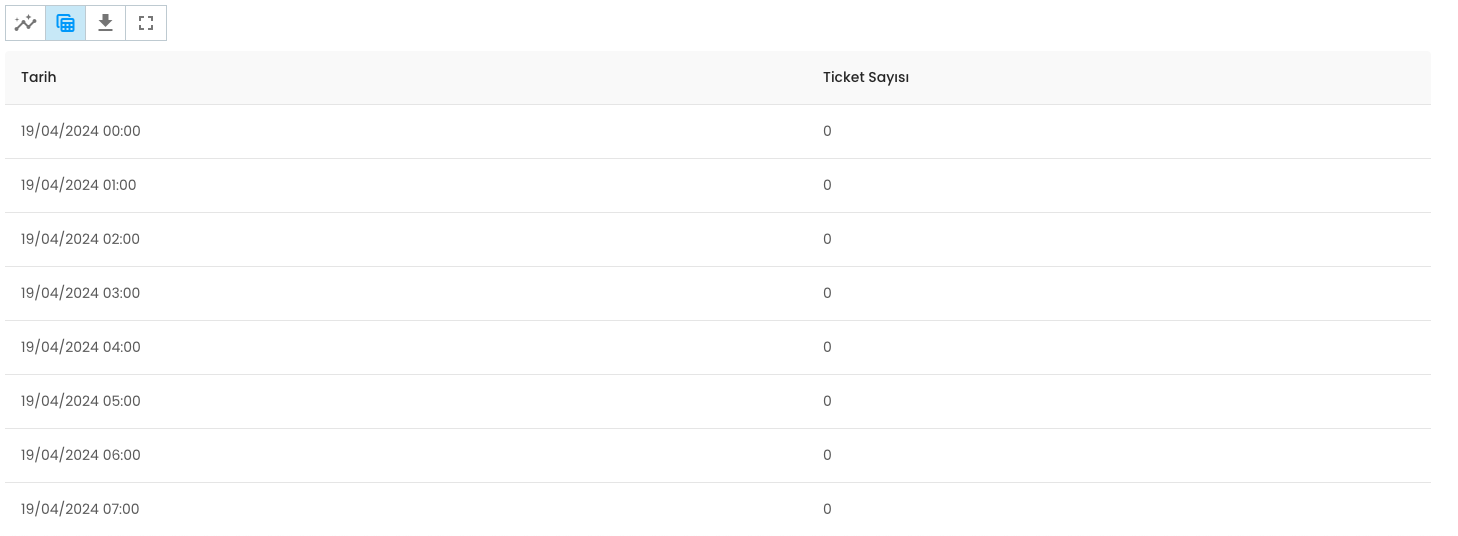
In this area, you can change how reports are displayed according to your needs. You can analyze data faster by visualizing it with chart view or perform detailed examination with table view. This flexibility allows you to evaluate data according to your different analysis needs.
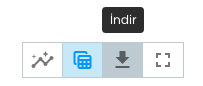
In this area, you can view and download reports in different ways according to your needs. You can save reports to your device using the "Download" button, thus providing offline access. Additionally, you can view reports in full screen mode by clicking the "Full Screen" button and perform detailed examination in a wide workspace. To exit full screen mode, simply click the same button again.
6.) Report Format and Import
In this area, you can enlarge the view of reports or charts using the zoom feature and examine details more closely. You can reset the zoom settings by clicking the "Zoom Reset" button to return the view to its original state. This feature helps you get a clearer view, especially when analyzing large datasets.
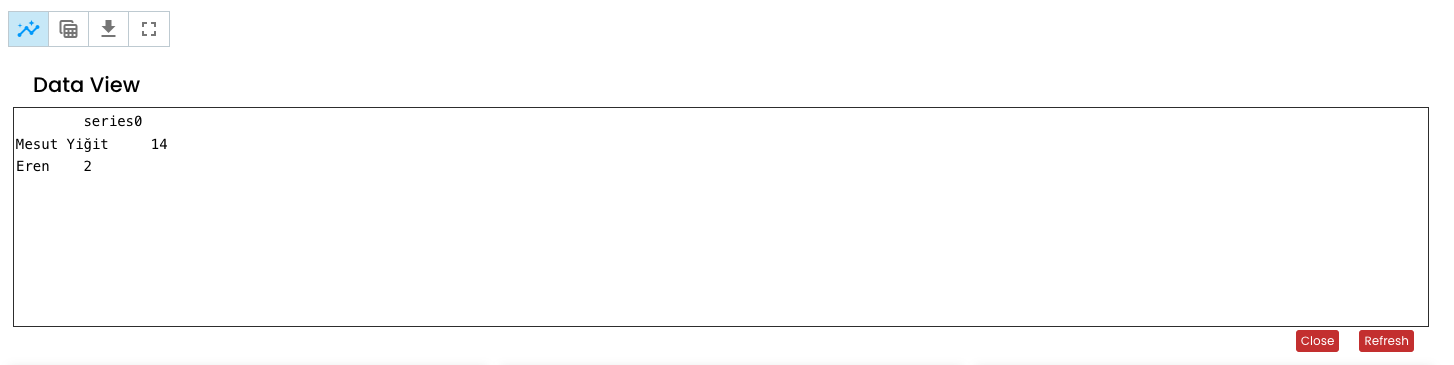
Additionally, you can view reports in text format using the "Data View" option. This view allows you to examine data in a more detailed and readable way. Seeing data in text format instead of table or chart gives you more flexibility, especially when working with raw data.
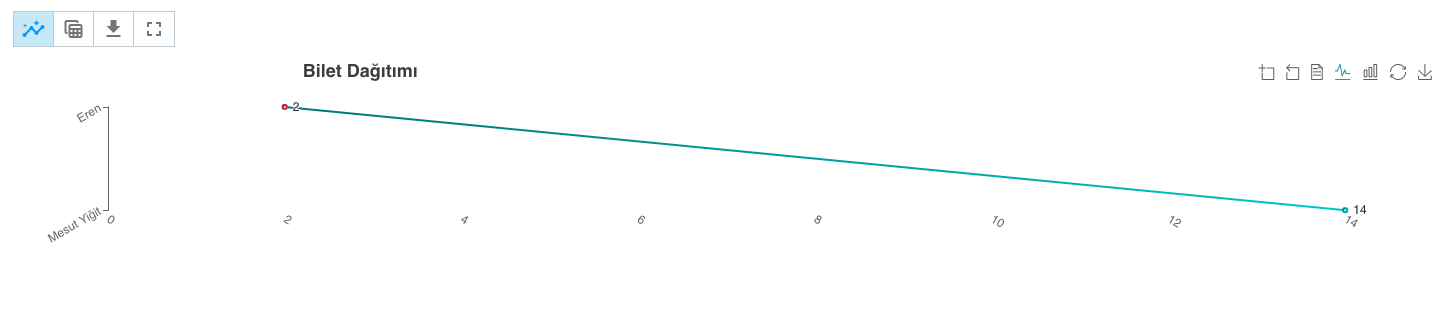
You can change the current chart view to line chart format using the "Switch to Line Chart" option. This feature allows you to observe changes in data over time more clearly and enables trend analysis. Line charts provide more effective visualization, especially in situations where data flow is continuous.
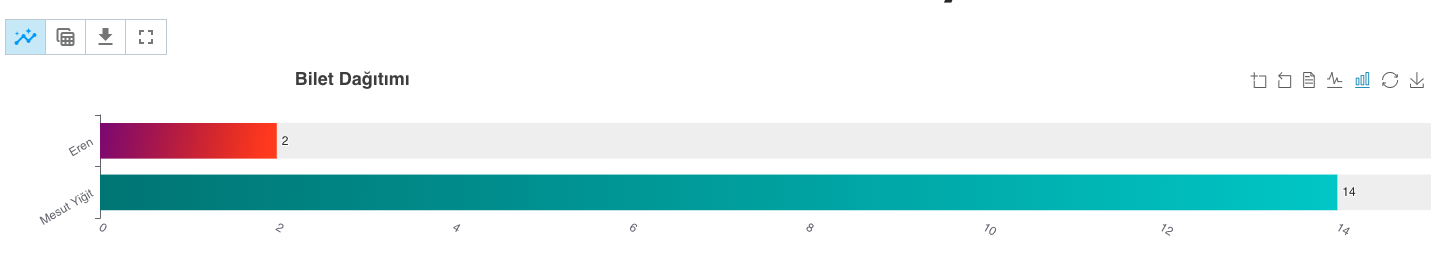
You can view the current chart as a progress bar (bar chart) format using the "Switch to Bar View" option. This view facilitates comparison of data and helps present categorical data in a more understandable way. Bar charts are quite effective for visually comparing data in different categories.
You can refresh the chart and view the current state of data by pressing the "Restore" button. This feature is useful for quickly seeing changes in your dataset and examining reports in their most recently updated state. By refreshing the chart, you can make the most accurate analysis with the latest data.
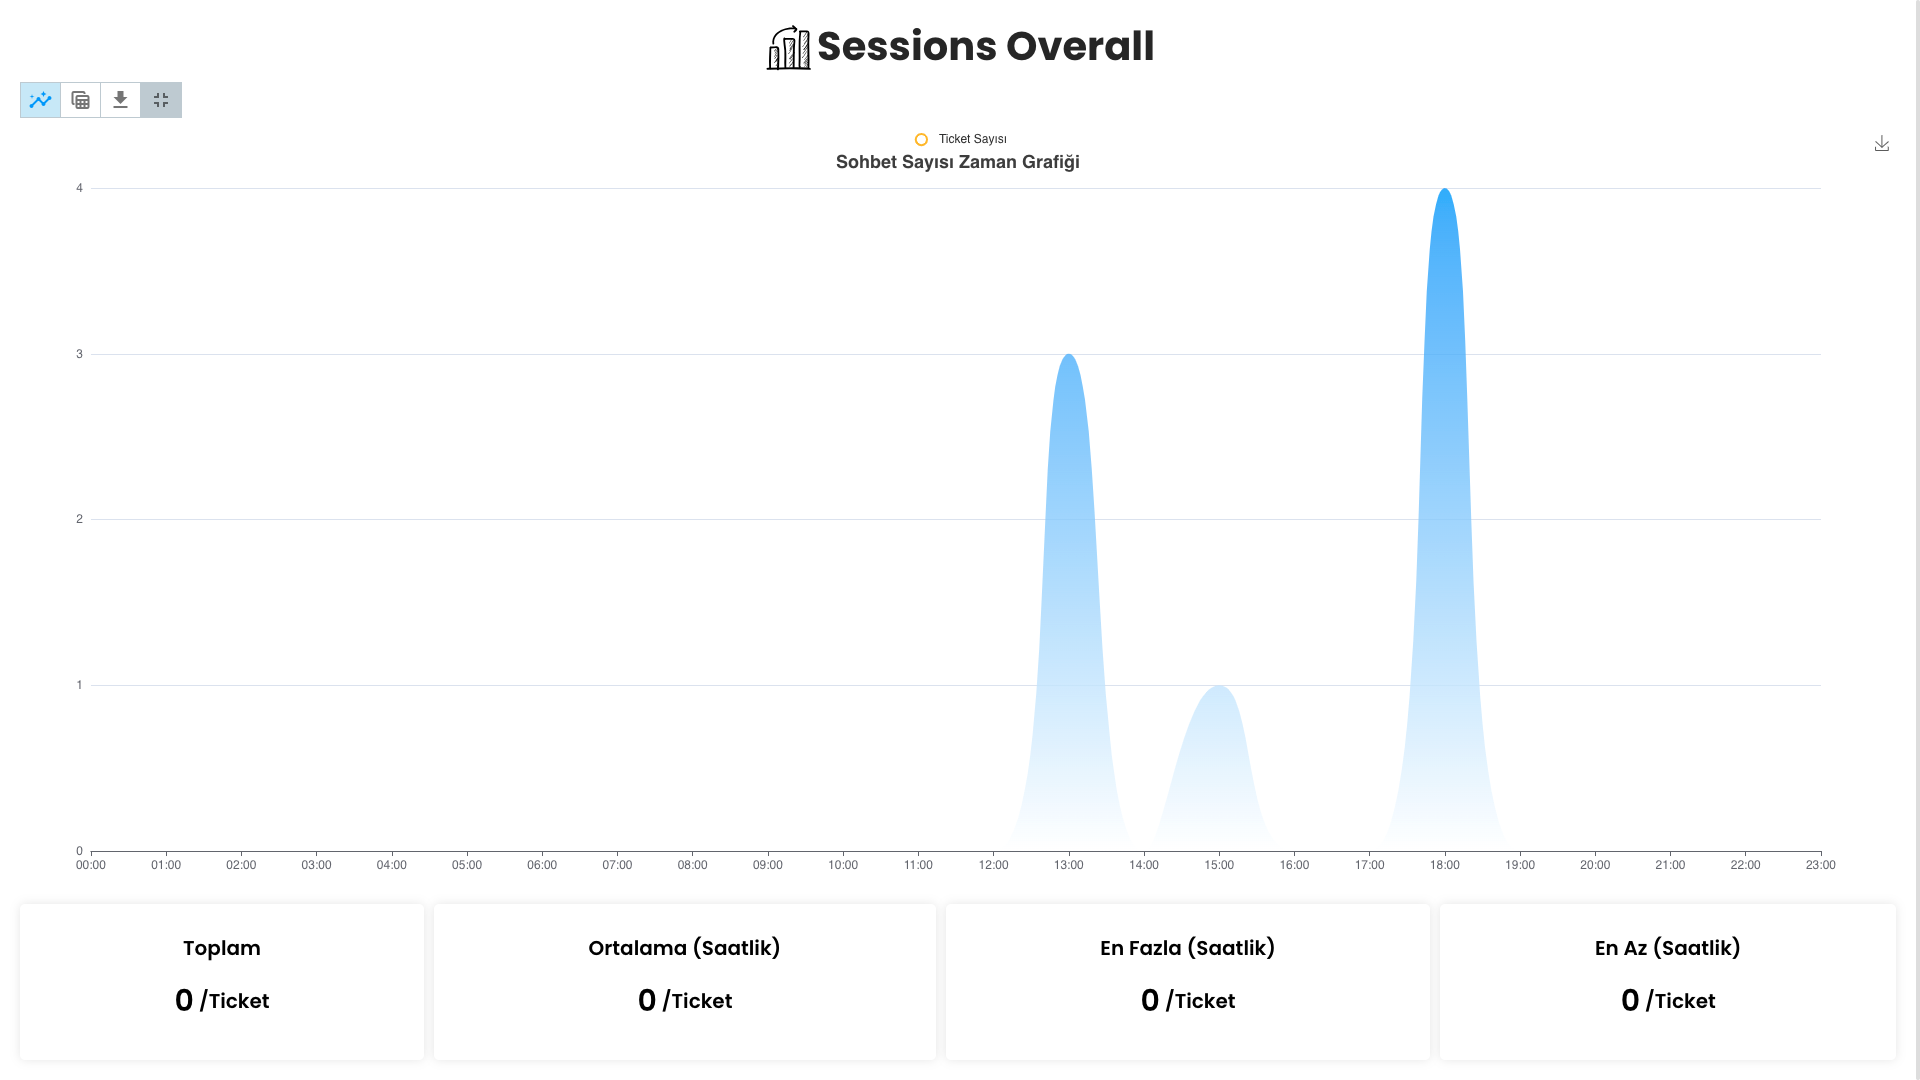
7.) Report Statistics
In this area, you can view important statistics such as Total Ticket Count, Chat Response Status, Chat Counts by Representatives. This data provides valuable information you can use to monitor the effectiveness of your support processes, evaluate team performance, and improve service quality.
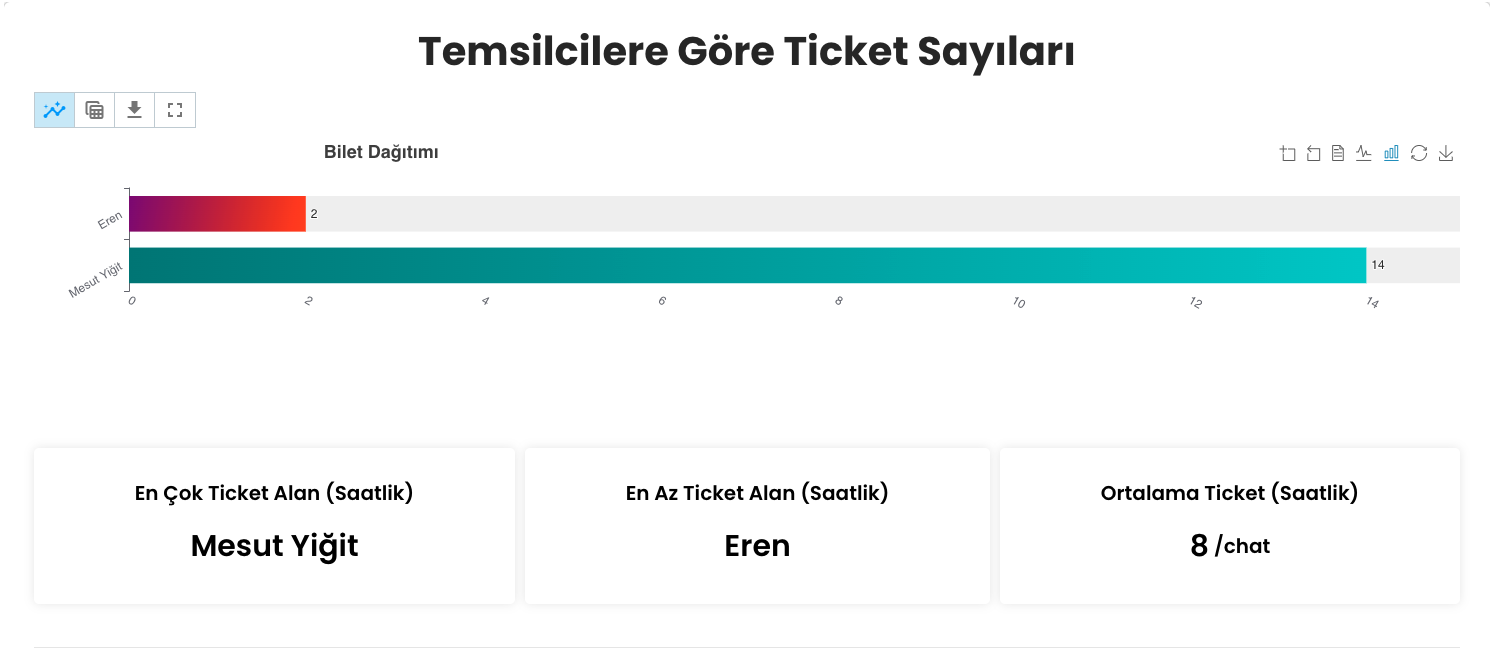
In this section, you can view detailed statistics such as representative with most tickets, representative with least tickets, and average ticket counts. This data helps you evaluate representative performance and distribute resources more efficiently. These statistics are quite useful for maintaining balance within the team and optimizing workload.
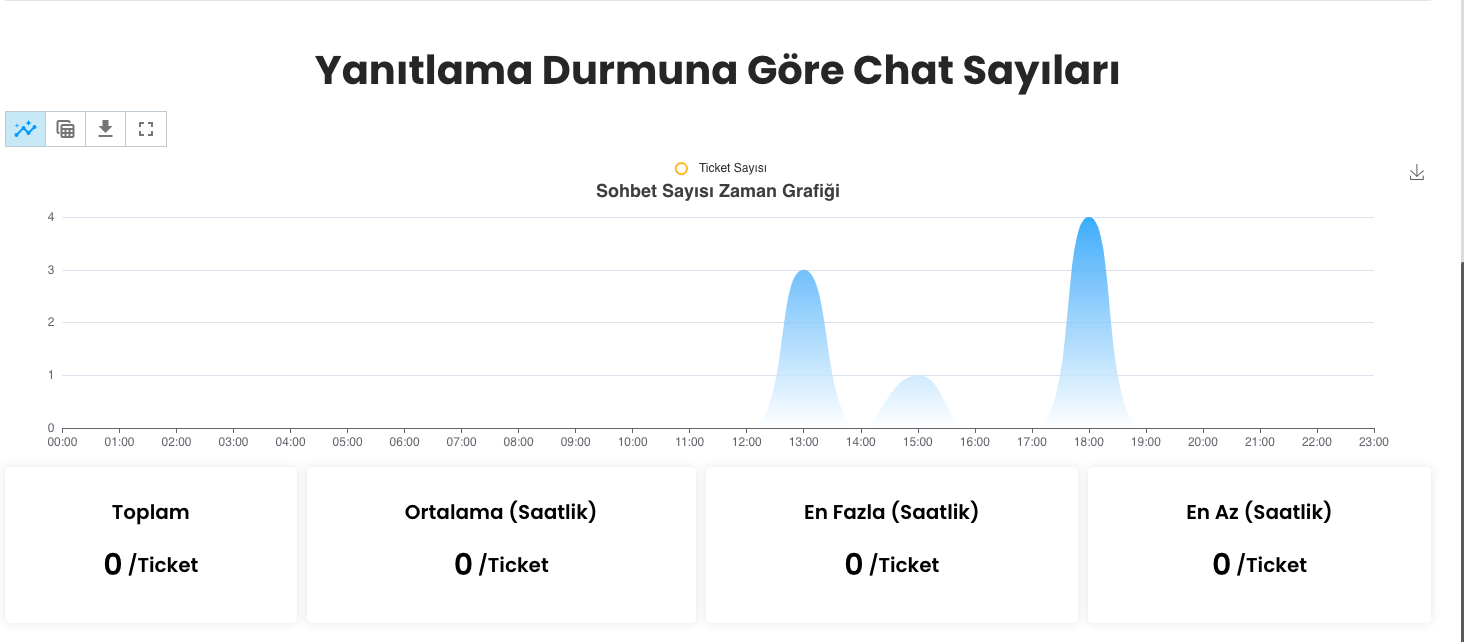
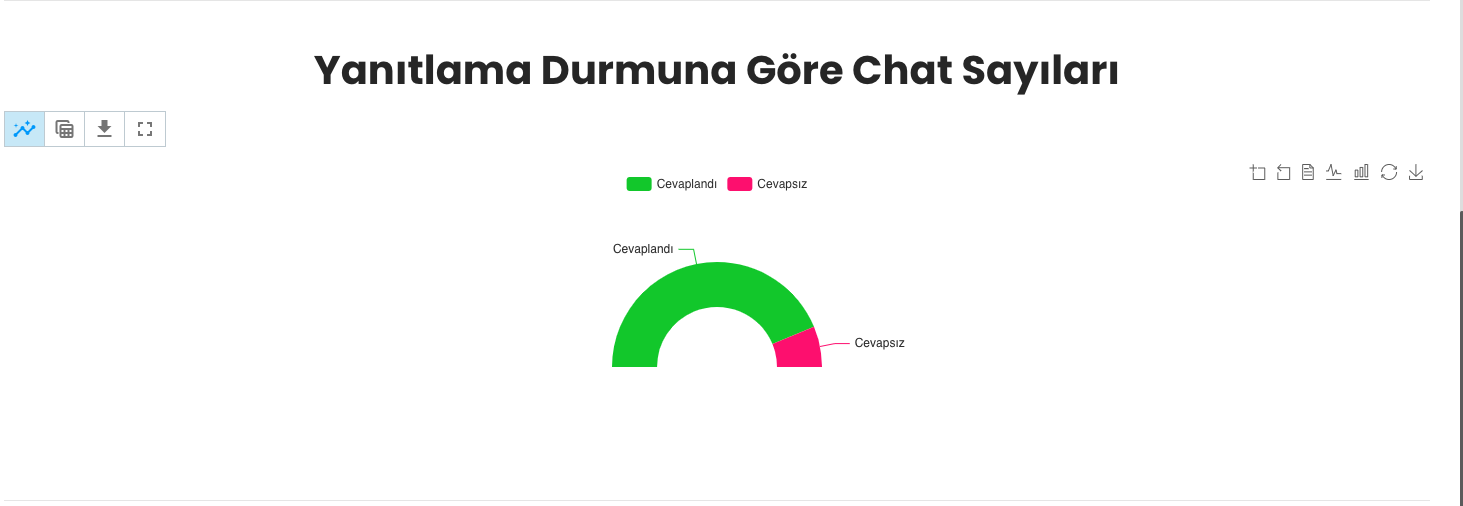
In this area, you can visually display your data as answered and unanswered chat counts on the chart. This feature helps you track unanswered requests while providing information about your support team's response time and effectiveness. If the number of unanswered chats is high, you can take necessary measures to improve your processes.
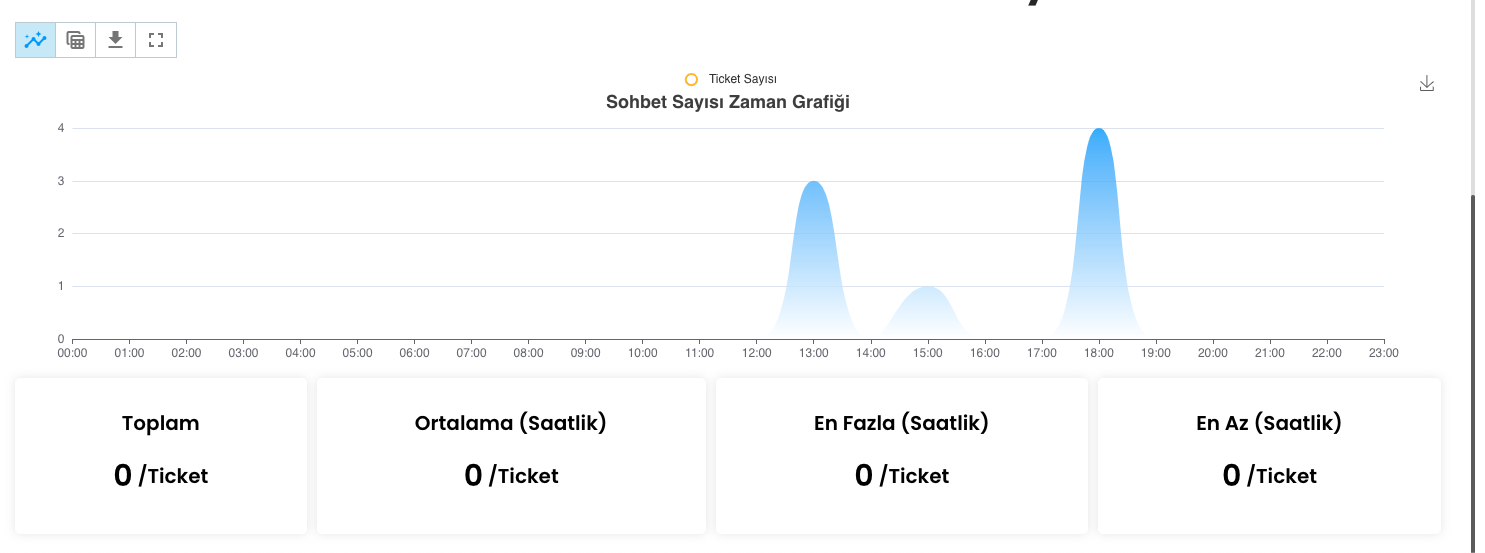
In this area, you can view important statistics such as Total Ticket Count, Hourly Average Ticket Count, Maximum Ticket Count, and Minimum Ticket Count. Additionally, you can analyze this data more understandably and effectively by visualizing it on the chart. The chart allows you to easily track data trends and evaluate your support team's performance by time periods.