Reports Page Usage and General Features
Reports Page Usage and General Features allows users to see different metrics and performance data in detail. This page offers various analyses and reports under many different categories so that users can make their business processes more efficient. Users can track their business performance, examine trends, and make data-driven evaluations to make strategic decisions when necessary through this page. The reports page is an important tool especially for managers and analysis teams, providing them with in-depth information in each category.
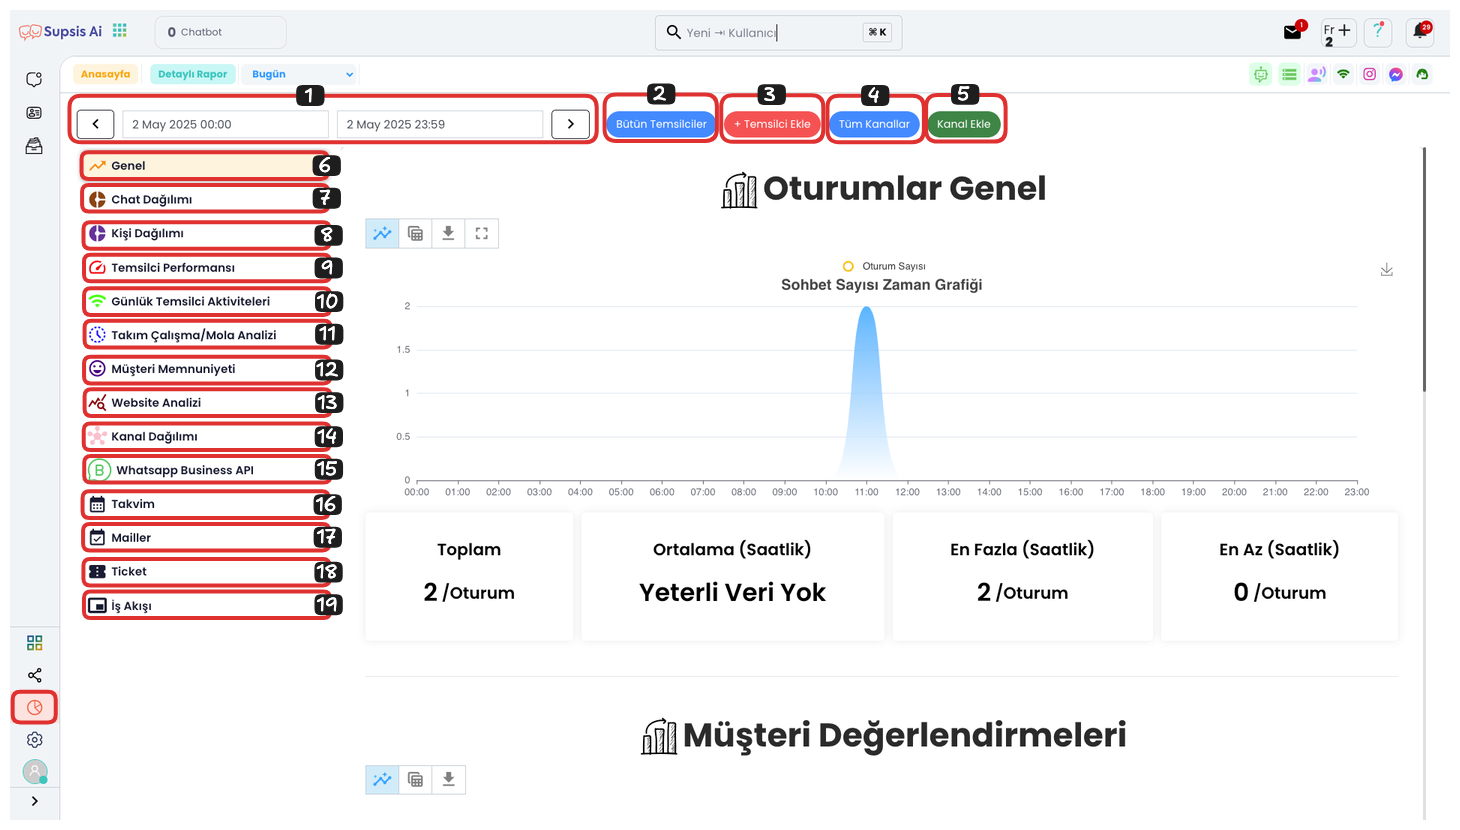
Reports Page Elements:
- Date Filter
- Representatives
- Add Representative
- All Channels
- Add Channel
- General
- Chat Distribution
- Person Distribution
- Representative Performance
- Daily Representative Activities
- Team Work/Break Analysis
- Customer Satisfaction
- Website Analysis
- Channel Distribution
- WhatsApp Business API
- Calendar
- Mails
- Ticket
- Workflow
1-) Date Filter
From this area, you can view reports with data between the dates you specify. This feature allows you to analyze performance in a specific time period and make decisions based on past data.
2-) Representatives
In this area, you can see which representative you are filtering the report for. If there is no representative filter, the expression "All Representatives" is displayed. This feature allows you to track a specific representative's performance more easily.
3-) Add Representative
If you want to view your reports according to a specific representative or representatives, you can filter by representative by clicking the "Add Representative" button. This way, you can examine only the data of the representatives you selected and analyze their performance in more detail.
4-) All Channels
After filtering by channel from this area, which channel the filtering was done from is displayed here. This feature allows you to analyze data coming through a specific channel and provides easy tracking of the filtered channel.
5-) Add Channel
To filter by channel from this area, you can click the "Add Channel" button to view reports for only a specific channel. This way, you can perform more specific analyses by focusing on the data of the channel you want.
6-) General
This section contains general session information. The chart visually presents the distribution of chat count over time in a specific time period. In the lower section, there are summary information such as total session count, average session count, maximum session count, and minimum session count. This data helps you better understand session traffic and track changes over time.
7-) Chat Distribution
This section shows how chats are distributed among different channels or representatives. It provides detailed information about the distribution of chats received by different channels (web, WhatsApp, email, etc.) or representatives. This feature helps you analyze the performance of each channel or representative and observe which areas provide more interaction.
8-) Person Distribution
9-) Representative Performance
Analyzes representative performance. This includes metrics such as response times and customer satisfaction scores. Information such as how quickly representatives respond and the average feedback they receive from customers is included in this section. This way, a comprehensive evaluation can be made about each representative's efficiency and customer interaction.
10-) Daily Representative Activities
Shows how active representatives are on a daily basis. It includes information such as how many chats they completed and how many customers they interacted with. This is useful for monitoring representatives' workload and daily performance. It is also an important tool for evaluating representatives' efficiency in time management and customer interaction.
11-) Team Work/Break Analysis
Provides information about team members' working hours and break times. This is a useful section for monitoring team efficiency and making adjustments when necessary. It also provides valuable insights about how efficiently team members work and when they need rest, guiding to optimize workflows.
12-) Customer Satisfaction
Shows customer satisfaction survey results and general satisfaction scores. This allows you to evaluate service quality based on customer feedback. It also provides valuable information about which areas you need to improve and helps you develop strategies to increase customer satisfaction.
13-) Website Analysis
Includes analysis of chats coming through the website. Information such as which pages chats were started from and which pages received the most interaction is available. This helps you determine which parts of your website provide more customer interaction. Additionally, this data guides you on which pages to focus on to improve your website's user experience and provide more interaction.
14-) Channel Distribution
Shows the distribution of chats coming through different communication channels (WhatsApp, web, email, etc.). This allows you to analyze which channels are used most and how customer interactions occur. It also allows you to make strategic decisions about which communication methods are preferred by evaluating the effectiveness of each channel.
15-) WhatsApp Business API
Includes analysis of chats coming through WhatsApp. This covers data obtained using WhatsApp Business API and provides details of interactions that occur through WhatsApp. This analysis can be used to evaluate the efficiency of messaging processes, quickly meet customer requests, and improve the quality of service provided through WhatsApp.
16-) Calendar
Includes calendar information of representatives and the team. This provides information about meetings and planned events and helps optimize the team's time management. Additionally, this section allows you to make strategic decisions about balancing workloads and increasing efficiency by observing team members' intensity.
17-) Mails
Includes analysis of chats coming through email. Information such as how many emails were received and response times is available. This allows monitoring the performance of customer interactions that occur through email. It also helps you make necessary arrangements to improve email response times, increase customer satisfaction, and provide more efficient communication through email.
18-) Ticket
Includes analysis of requests coming through tickets. It provides detailed reporting with tracking of data such as ticket counts by representatives and chat counts by response status. This can be used to evaluate each representative's workload and performance, improve management of unanswered requests, and optimize the general ticket management process.
19-) Workflow
Includes analysis of tasks in the workflow. It performs analysis of many task features such as who gets the most tasks, who gets the least tasks, and total task counts. This allows evaluating team members' workloads, observing how tasks are distributed, and optimizing task performance. It also helps you make necessary improvements to increase efficiency by identifying potential bottlenecks in the workflow.