General Page Information
General Information
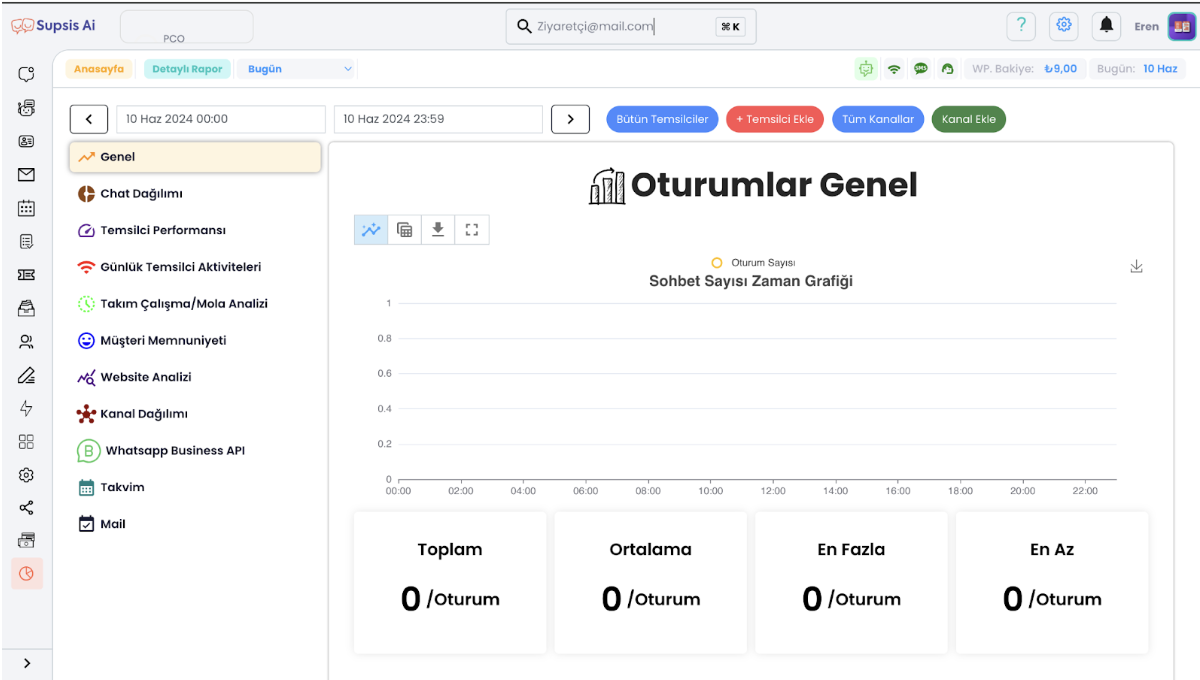
The reports page provides detailed data about sessions, customer evaluations, representative performance, and more. Through this page, users can evaluate their performance by analyzing various metrics.
Chart and Table View
Chart View:
Data is presented in charts that can be analyzed visually. For example, like a session count time chart.
Table View:
Thanks to the buttons next to the charts, you can convert chart data to table view and perform detailed examination.
Chart Download:
You can download charts to your device and save them in different formats using the download button in the top right corner of the chart.
Sample Reports and Charts
General Sessions:
- Chat Count Time Chart: Shows the number of chats conducted in a specific time period.
- Total, Average, Maximum, Minimum Sessions: Provides information about the total session count, average session duration, maximum and minimum sessions conducted in the selected date range.
- Table and Chart Download: Charts can be converted to table view and downloaded.
Customer Evaluations:
- Voting Chart: Shows customer evaluations on a timeline.
- Total Evaluation Count, Average Evaluation, Weighted Average Evaluation: Provides information about the number and average scores of customer evaluations.
General Session Duration:
- Session Duration Chart: Shows the durations of sessions conducted in a specific time period.
- Total Session Duration, Chatbot and Representative Session Durations: Provides detailed information about chatbot and representative session durations.
This way, you can analyze your performance in detail through the reports page, convert your data to table view when necessary for more detailed examination, and archive your reports by downloading charts.