Customer Satisfaction
This section contains evaluations and analyses related to customer satisfaction. The following charts and metrics are found on this page:
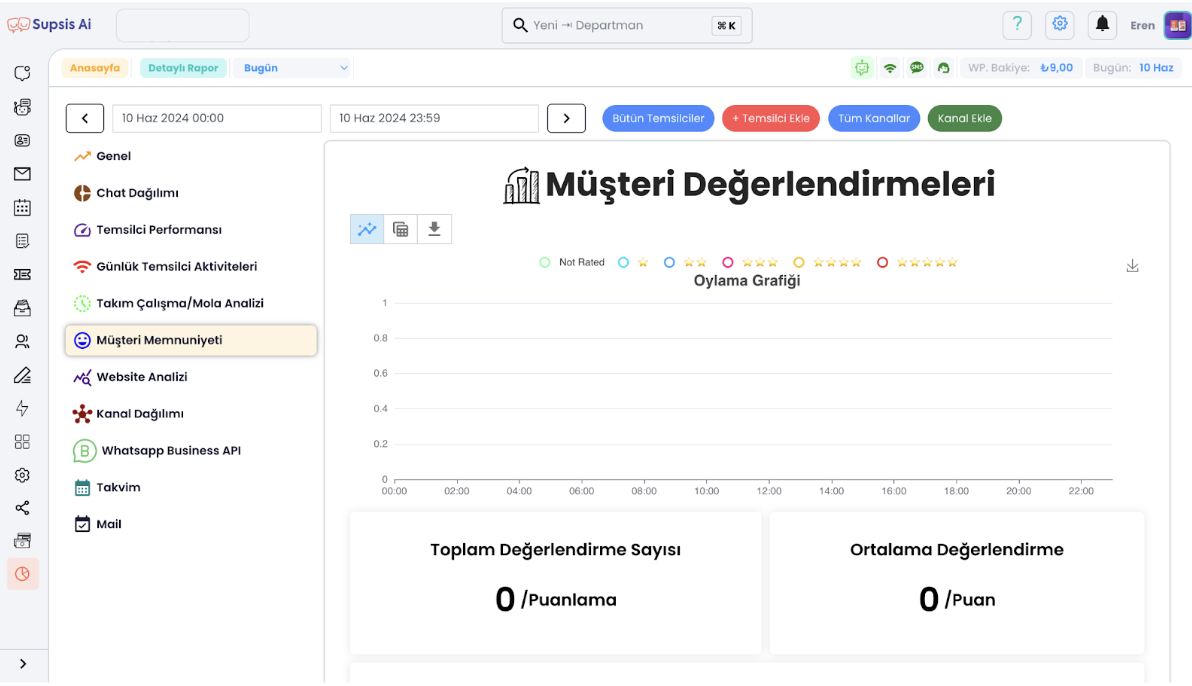
Voting Chart
- Voting Chart: A chart showing how evaluations made by customers change over time. This chart allows you to track trends in customer satisfaction.
- Chart Options: The chart can be converted to table view and downloaded using the icons in the top right corner of the chart.
Total Evaluation Count
- Total Evaluation Count: Shows the total number of evaluations made by customers. This helps you understand how many customers provided feedback.
Average Evaluation
- Average Evaluation: Shows the average of evaluation scores given by customers. This metric measures the general customer satisfaction level.
Weighted Average Evaluation
- Weighted Average Evaluation: Shows the weighted average of customer evaluations. This average, calculated by giving more weight to some evaluations, provides a more accurate satisfaction analysis.
Evaluation Distribution
- Evaluation Distribution: A table showing how many evaluations received how many stars. This table helps you understand the general distribution of customer feedback.
Representative Wait Time Chart
- Representative Wait Time Chart: Shows the time it takes for representatives to respond to customers. This chart tracks changes in wait times over time and helps you evaluate representative performance.
- Chart Options: The chart can be converted to table view and downloaded using the icons in the top right corner of the chart.
Wait Time Metrics
- Average Wait Time: Shows the average time customers wait for representative response. This metric is used to measure the speed of customer service.
- Maximum Wait Time: Shows the longest time customers wait for representative response. This metric allows you to understand worst-case scenarios.
- Minimum Wait Time: Shows the shortest time customers wait for representative response. This metric measures the best response times.
Comment Analysis
- Comment Analysis: Lists the best and worst comments made by customers. Shows the names, scores, and comments of customers who made the comments. This analysis provides more in-depth information about customer satisfaction and can be used to improve representative performance.
These metrics and charts are important for monitoring and improving customer satisfaction. Additionally, data can be examined in more detail using filters and date range selections at the top of the page.