Chat Distribution General Information
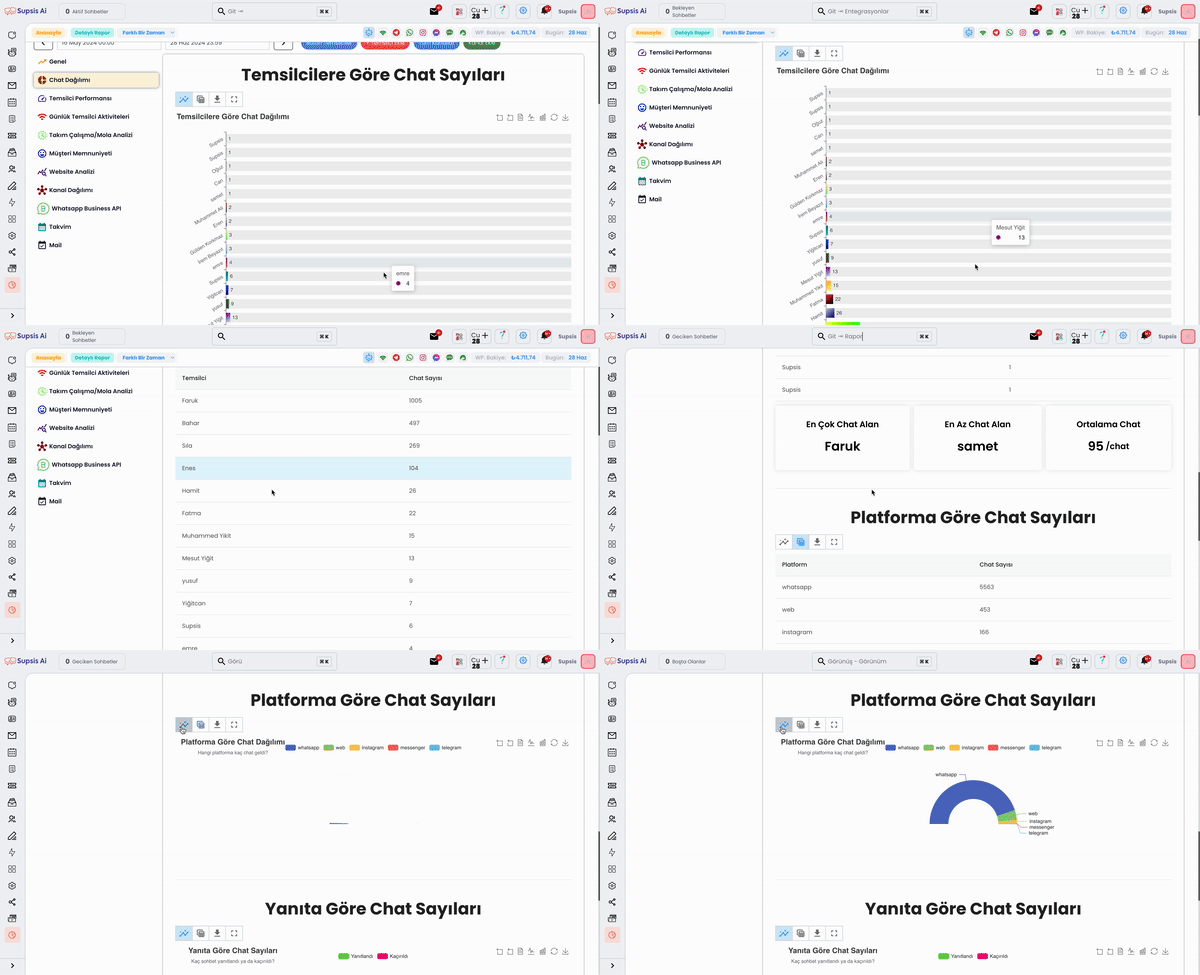
This page visualizes the chat distribution of your representatives. You can easily track how many chats each representative received and compare their performance. This helps balance the workload of team members and plays an important role in performance evaluations.

Chat Distribution by Representatives
Chat Distribution by Representatives: In the chart, you can see the number of chats each representative received in the form of colored bars. The top bar represents the representative who received the most chats, while the bottom bar represents the representative who received the least chats. Through this chart, you can analyze the workload distribution of team members and distribute chats in a balanced way if necessary.
Data View Options
- Table View: Used to display data in table format.
- Chart Download: You can use this option to download the chart in various formats (PDF, PNG, etc.).
Highlighted Data
- Most Chat Receiver: The name and chat count of the representative who received the most chats is specified here.
- Least Chat Receiver: The name and chat count of the representative who received the least chats is specified here.
- Average Chat: Shows the average number of chats per representative.
Chat Counts by Platform General Information
Chat Counts by Platform: This section helps you analyze the number of chats coming from different platforms. This way, you can track how many chats came from which platform.
Chat Distribution by Platform
In the chart, chat counts from different platforms are visualized. Different colors are used for each platform such as WhatsApp, web, Instagram, Telegram. This distribution allows you to understand which platforms are more active and through which channels customer interactions occur.
Data View Options
- Table View: Used to display data in table format.
- Chart Download: You can use this option to download the chart in various formats (PDF, PNG, etc.).
Chat Counts by Response General Information
Chat Counts by Response: This section analyzes the number of answered and missed chats. You can observe how much of customer interactions were answered on time or missed through this chart.
Chat Counts by Response
In the chart, answered and missed chat counts are shown in colored slices. Green color represents answered chats, while pink color represents missed chats. This way, you can analyze team performance and customer satisfaction.
Data View Options
- Table View: Used to display data in table format.
- Chart Download: You can use this option to download the chart in various formats (PDF, PNG, etc.).
Chat Distribution by Responder General Information
Chat Distribution by Responder: This section allows you to analyze which representative, chatbot, or hybrid answered the chats.
Chat Distribution by Responder
In the chart, the distribution of representative, chatbot, and hybrid responses is shown in colored slices. This distribution allows you to see which chats were answered by human representatives and which chats were answered by chatbots.
Data View Options
- Table View: Used to display data in table format.
- Chart Download: You can use this option to download the chart in various formats (PDF, PNG, etc.).