Supsis Chatbot Reports
Chatbot Reports provide comprehensive reporting tools to increase efficiency in customer services and business processes. Through these reports, you can monitor chatbot performance in real-time, analyze interactions with users in detail, and make your processes more effective based on the data obtained. Chatbot reports help you determine which questions are frequently asked, which responses satisfy users, and where human support is needed. Additionally, operational strategies can be developed through metrics such as user behaviors, conversation durations, and conversion rates. This way, both customer satisfaction increases and support costs decrease.
Chatbot Reports Elements:
- All Chats
- Overall
- Busiest Period
- Scoring Distribution
- Popularity
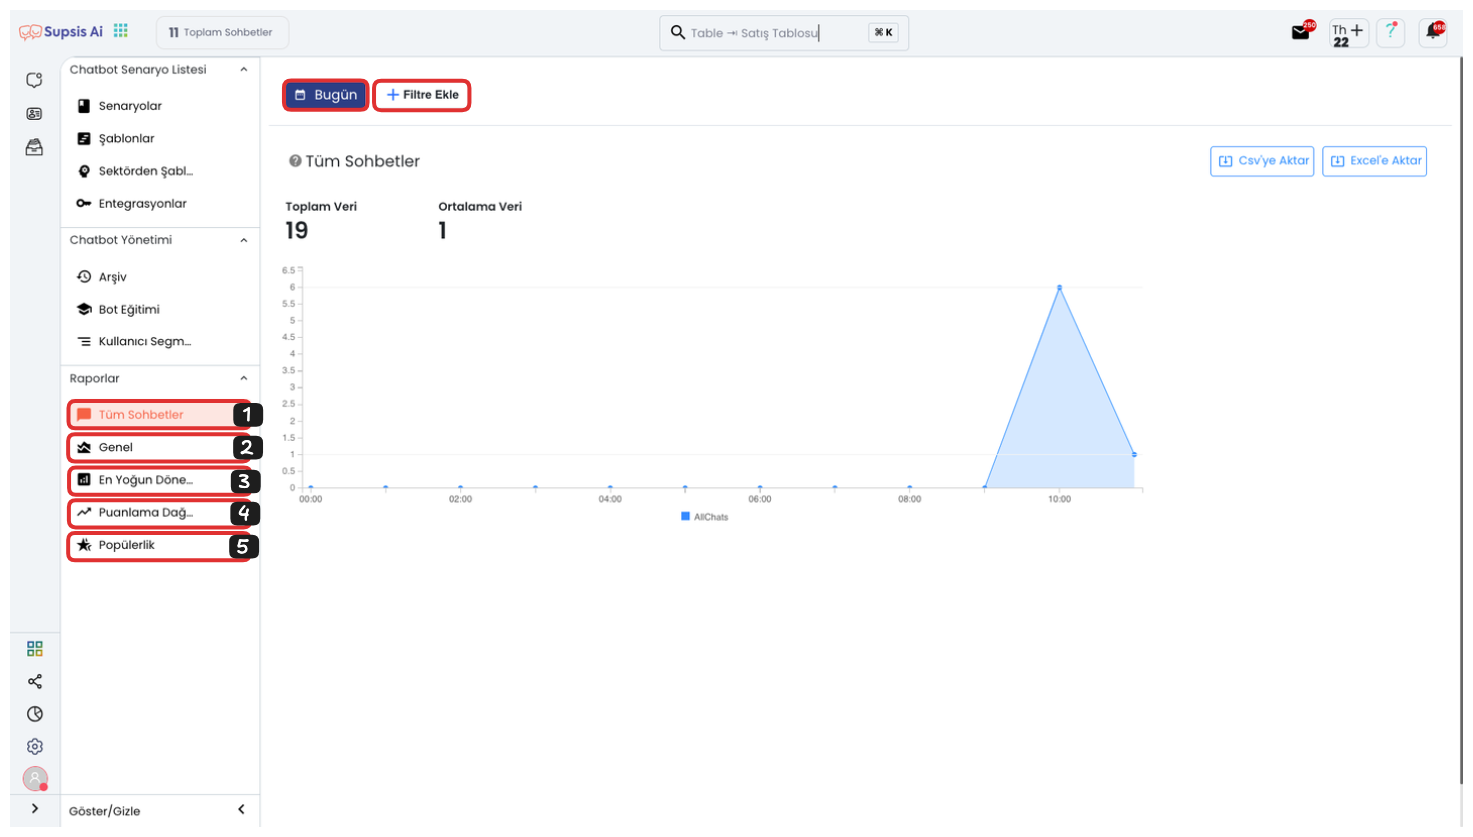
1-) All Chats
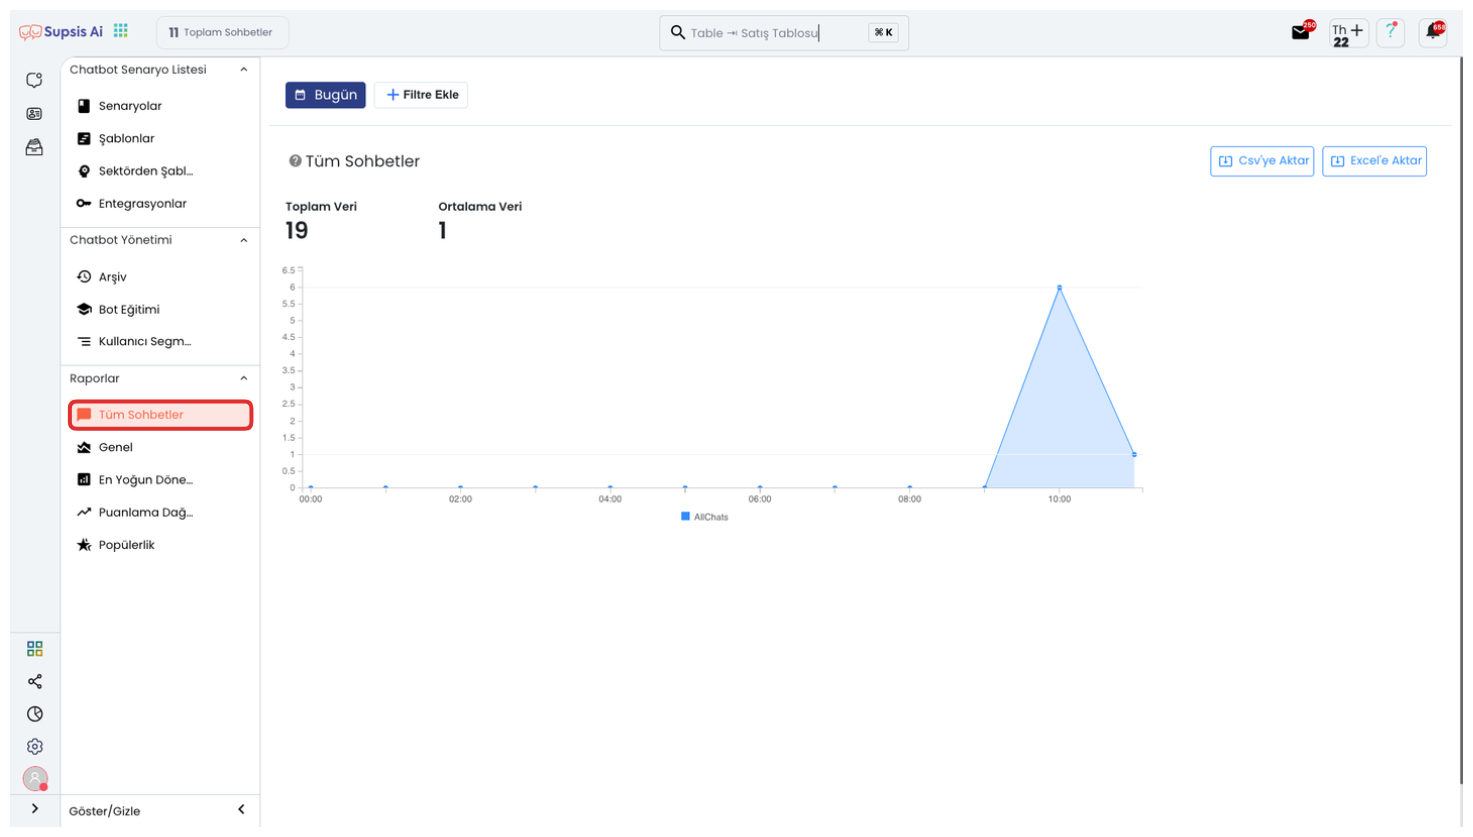
The All Chats section contains detailed records and analyses of all conversations conducted with the chatbot. Through this report, you can access the number of chats that took place in specific date and time intervals, and see in which time periods users are more active. You can evaluate interaction depth through average chat lengths, and easily distinguish successful conversations that satisfy users from failed chats that are unsatisfactory, incomplete, or require redirection. This data allows you to determine which topics the chatbot is used more intensively for, common problems, and areas that need improvement.
2-) Overall
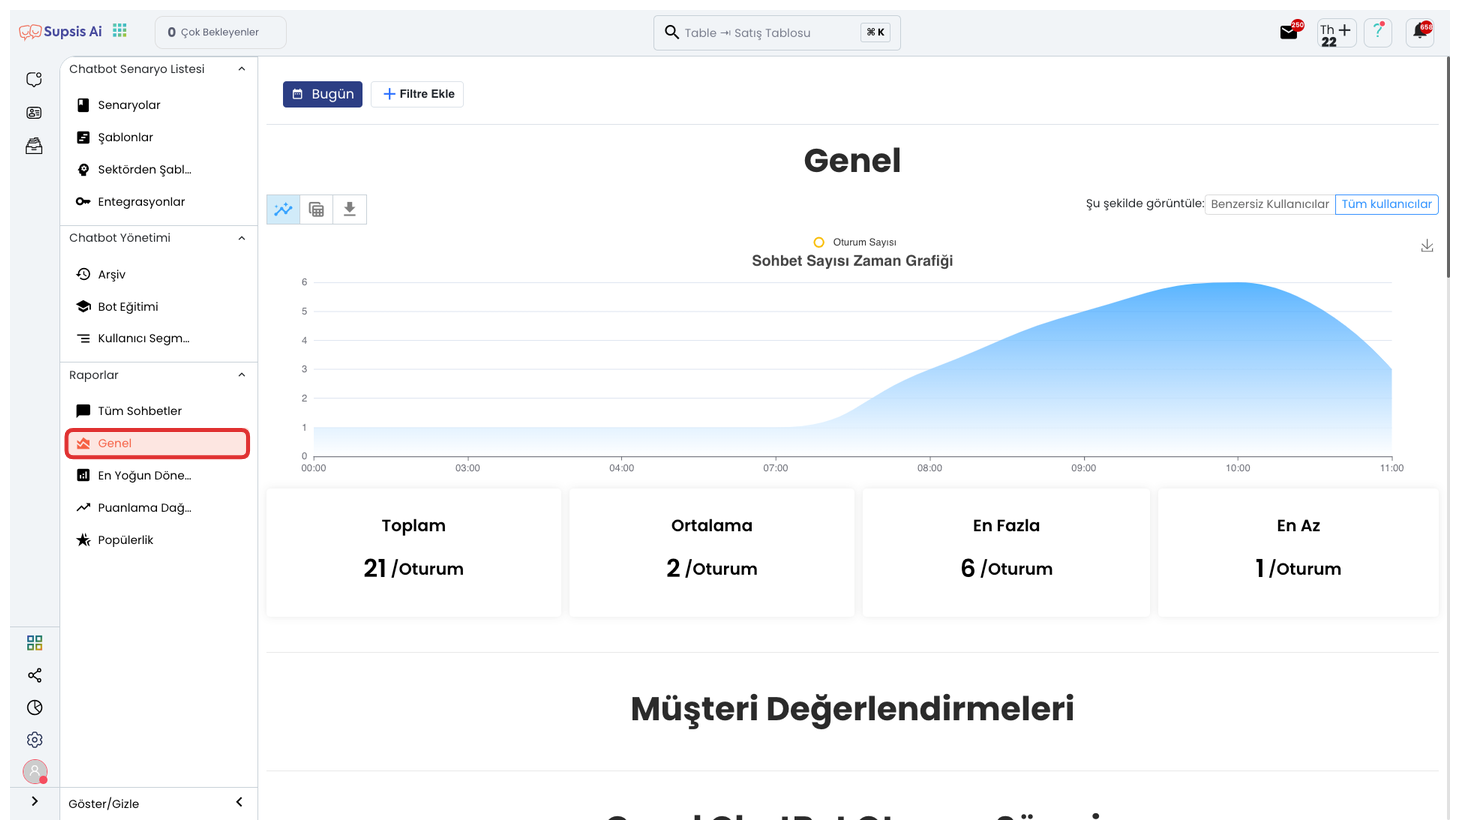
The Overall report section provides comprehensive data that evaluates the chatbot's performance and effectiveness from a broad perspective. Through this report, you can analyze the general communication intensity with users by viewing the total interaction count. The average response time data reveals how quickly the chatbot reacts and is a critical indicator in terms of user experience. Solution rates show to what extent the chatbot provides successful responses and resolves problems. These metrics not only measure the chatbot's general efficiency and operational effectiveness, but also clearly reveal the points where performance needs to be improved.
3-) Busiest Period
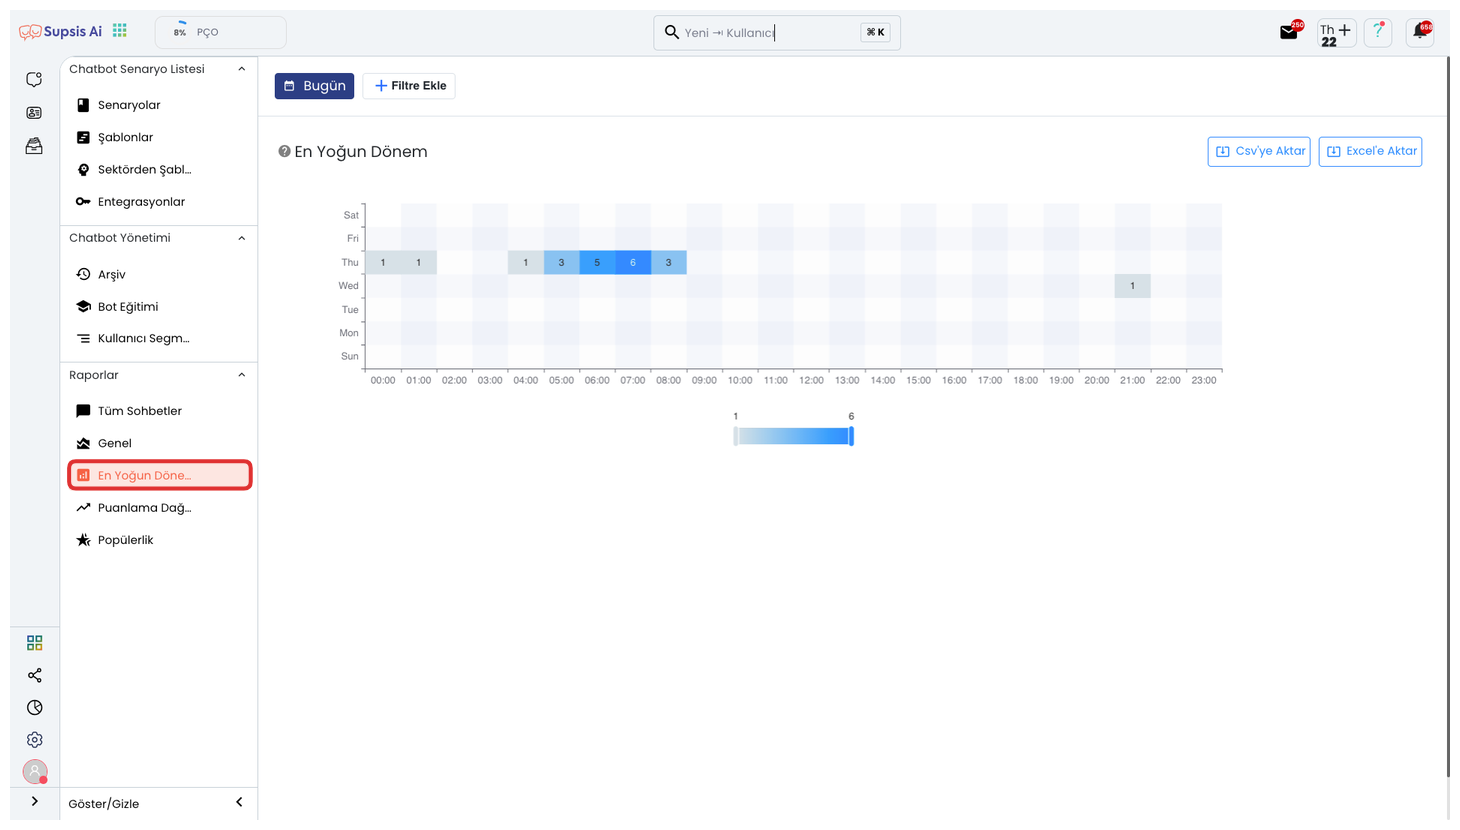
The Busiest Period report shows in detail which days and hours the chatbot is used most. Through this report, you can analyze chat intensities on a time basis and identify the periods when user interactions occur most. Especially in customer service processes, knowing which time intervals receive more support requests allows you to plan representatives more efficiently. Additionally, by tracking intensity trends in chatbot usage, you can distribute system resources more accurately and optimize workforce according to busy hours. This data is critical for increasing customer satisfaction and reducing response times.
4-) Scoring Distribution
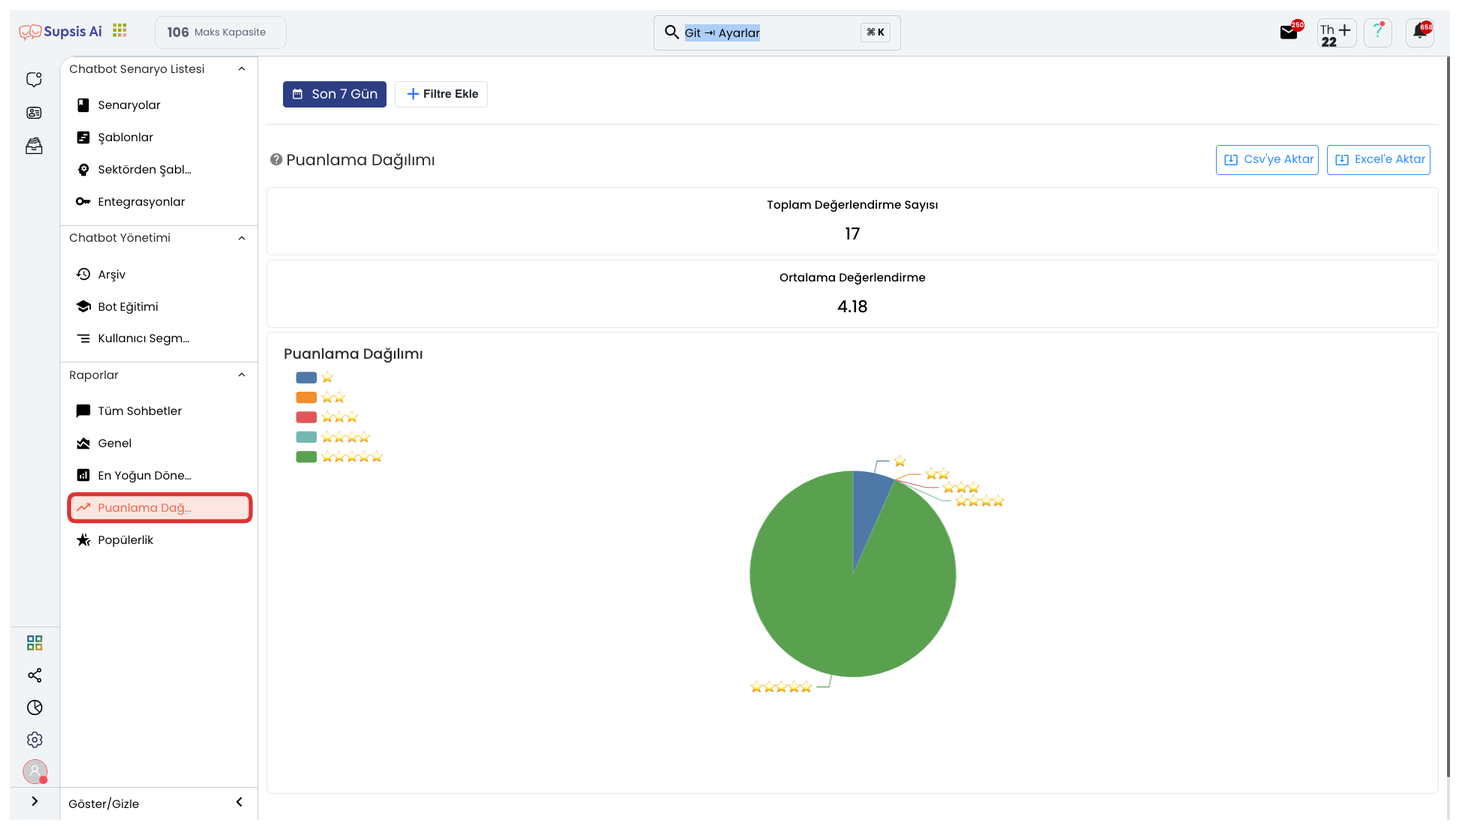
The Scoring Distribution report contains the analysis of scores given by users after their chatbot experience. Through this report, you can view user satisfaction scores and evaluate how the chatbot is generally received. Thanks to positive and negative feedback rates, it clearly reveals which interactions are successful and in which situations users experience dissatisfaction. This data provides important feedback for increasing customer satisfaction, improving user experience, and making the chatbot provide more effective service. Additionally, periodic performance changes can be tracked through score distribution.
5-) Popularity
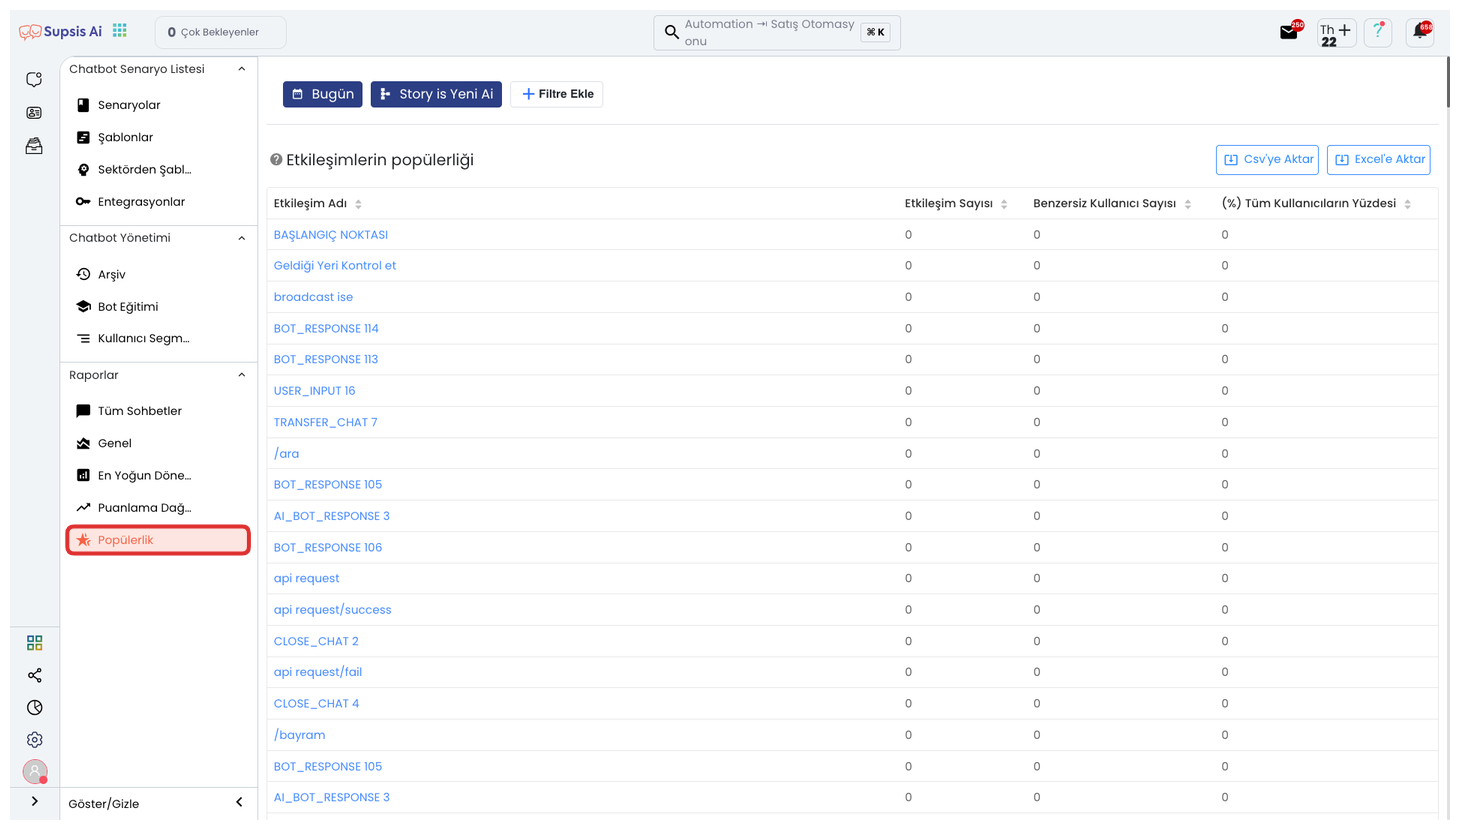
The Popularity report reveals the questions and features that users interact with most with the chatbot. Through this report, you can analyze in detail the most frequently asked questions, most discussed topics, and the chatbot functions that users use most. Knowing which areas users turn to most in their search for information allows you to make your content and response scenarios more targeted. At the same time, you can measure the contribution of heavily used features to user experience and develop improvement strategies for less used sections. This data provides important insights for continuously improving your chatbot and offering more accurate and effective solutions to user needs.
Filtering
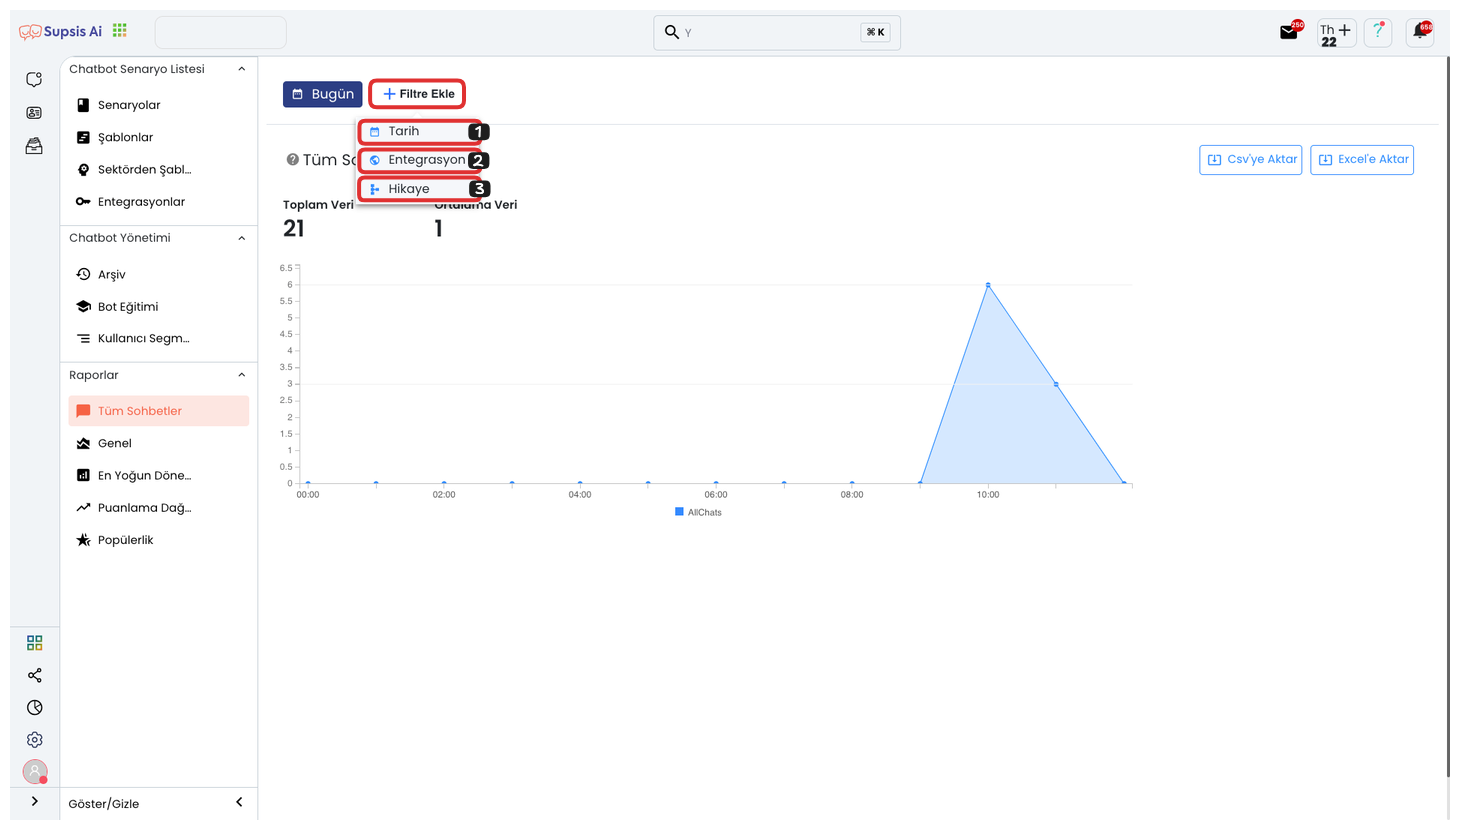
Filtering Elements:
- Date
- Integration
- Story
1-) Date
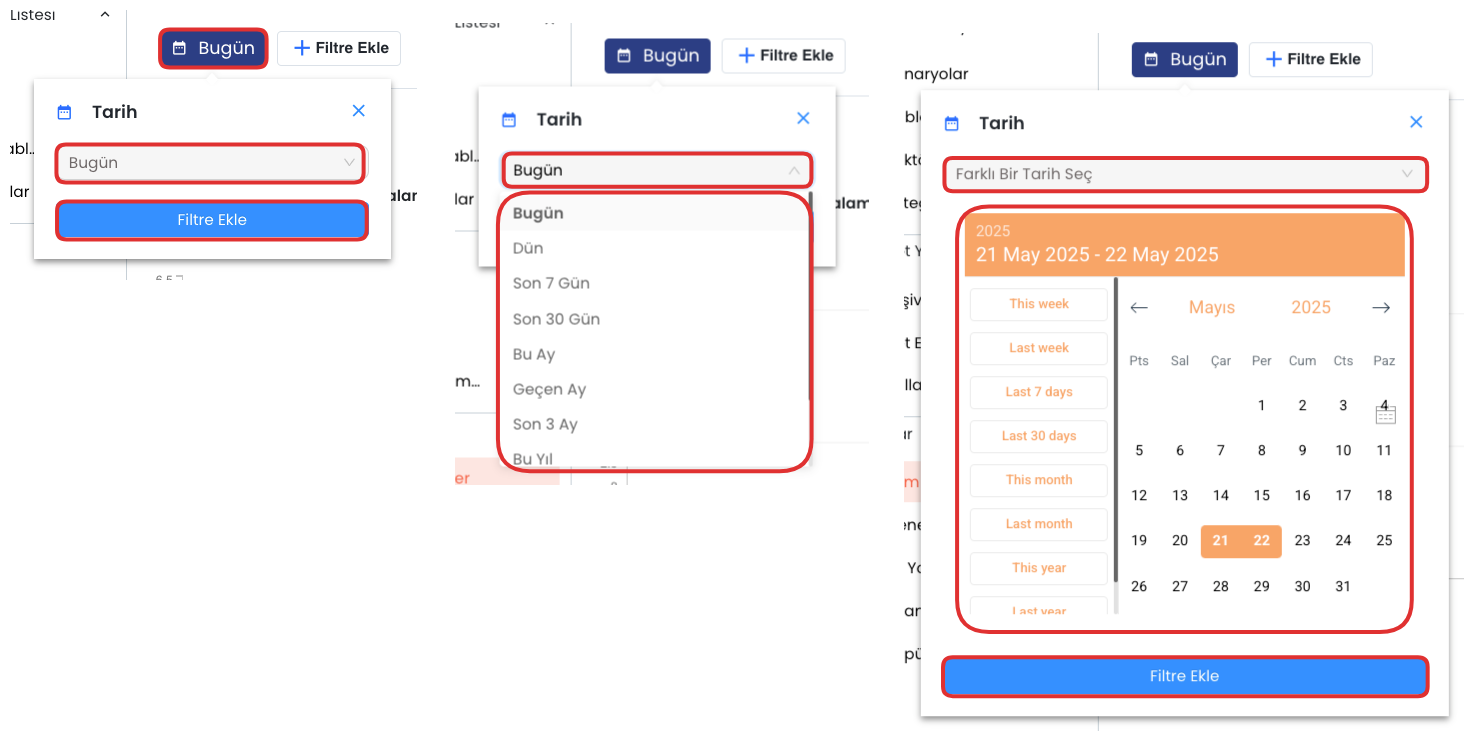
The Date Filter allows you to view report data within a specific time period. For this filtering operation, first click the "Add Filter" button and select the "Date" option from the opened menu. Then determine one of the ready date ranges such as "Today", "Last 7 Days", "This Month", "Last 3 Months" from the dropdown list. After making your selection, you can activate the filter by clicking the "Add Filter" button again. If you want to use a custom date range outside of standard options, you can mark the "Select a Different Date" option and manually determine start and end dates, performing a custom filtering between two dates. This way, you can make more targeted analyses and conduct detailed examinations on historical data.
2-) Integration
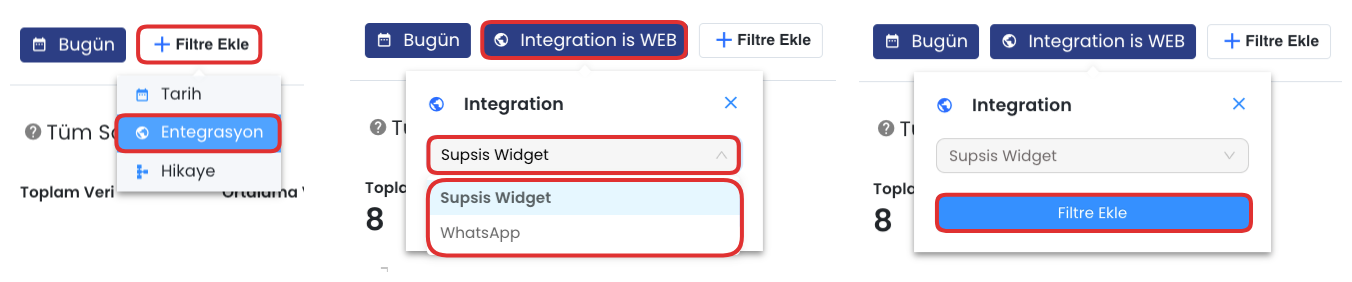
The Integration Filter allows you to filter reporting data according to the platforms where the chatbot works integrated. Through this filter, for example, you can view separate reports specific to the chatbot's interactions with website, WhatsApp, Facebook Messenger or another third-party system. For the filtering operation, first click the "Add Filter" button and select the "Integration" option from the opened menu. Then determine the relevant integration channel from the dropdown list that appears. After making your selection, complete the operation by clicking the "Add Filter" button again. After these steps, only data belonging to the integration source you selected is displayed on your report screen. This way, you can make channel-based performance comparisons and analyses, and develop separate improvement strategies for each platform.
3-) Story
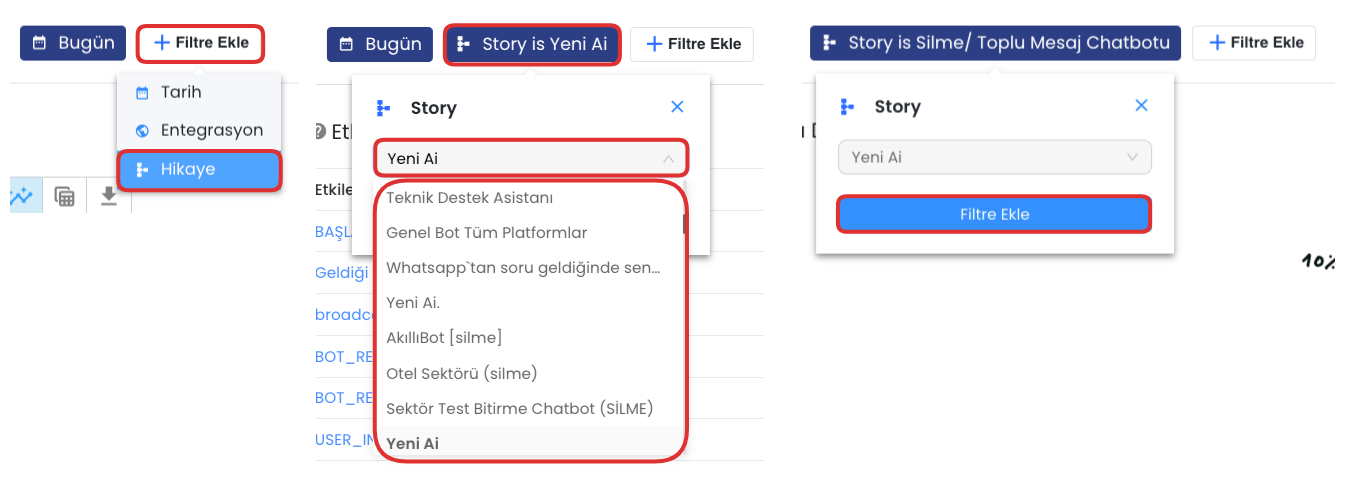
The Story Filter allows you to filter reporting data according to the story structures created for your chatbot. Through this area, you can examine user interactions that take place within a specific story flow separately. For the filtering operation, first click the "Add Filter" button and select the "Story" option from the opened menu. Then determine one of the stories you have previously created from the dropdown list in the opened area. After making your story selection, activate the filter by clicking the "Add Filter" button again. When you complete these steps, chat history, interaction counts and performance data belonging to the selected story can be analyzed separately. This way, you can evaluate the success of each story scenario and perform content optimizations when necessary.