Interaction Popularity Reports
The Chatbot Popularity area allows you to analyze in detail which topics, questions or features the interactions that Supsis Chatbot performs with users are concentrated around. These reports visualize and present which interaction types users are most interested in and in which time intervals these interactions take place. Thanks to popularity reports, you can clearly determine which features of the chatbot stand out and which information or services users need more.
Chatbot Popularity Reports allow you to examine in detail the interactions that users perform with Supsis Chatbot. These reports are developed to analyze which steps are used more frequently, which scenarios are preferred more, and users' trends within the bot. Especially frequently used blocks play an important role in making improvements by comparing with content that receives less attention.
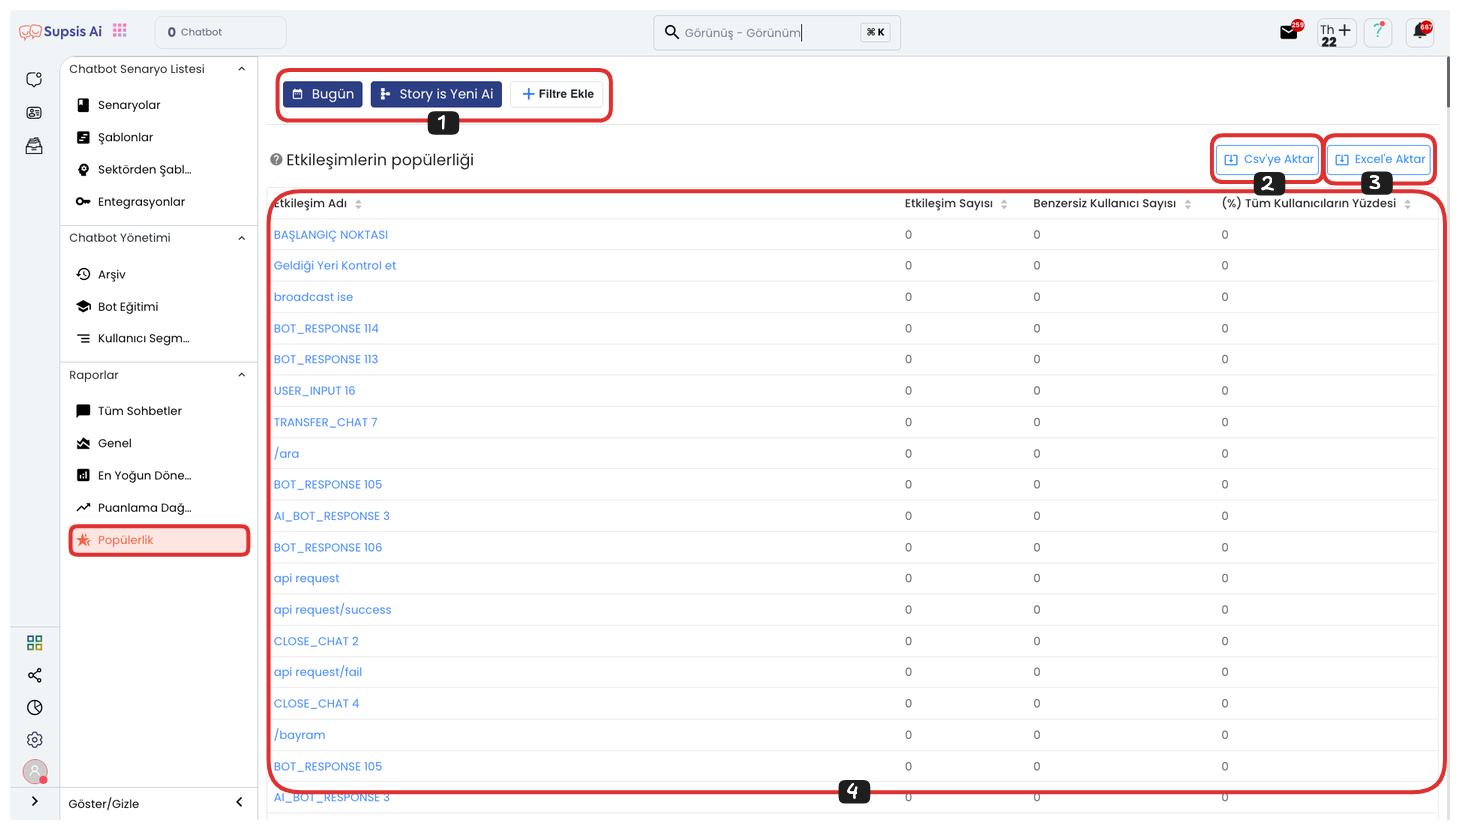
You can customize the report data with the filtering options in the upper left corner of the page. From here, you can select a specific time period using the date filter, separate data by platform with the integration filter, or examine specific scenarios with the story filter. These filters allow you to focus only on the data you need.
Thanks to the "Export to CSV" and "Export to Excel" buttons in the upper right corner, you can export the data you view, use it in different systems or share it in reports. This both speeds up the analysis process and facilitates data sharing with the team.
The chart and table area in the lower section of the page visualizes user interactions. You can easily understand how much each step is used through the chart, and see in detail the total usage count, unique user count, and the ratio of this data to the general user base for each interaction step through the table.
These reports help you improve your chatbot performance by correlating it with user behaviors. You can strengthen frequently used interactions, make less used ones more visible, or simplify your bot flow by removing them. This way, you can offer a more effective and user-friendly chatbot experience.