Chatbot Scoring Distribution
Chatbot Scoring Distribution presents a detailed analysis of the scores given by users after their conversations with the chatbot. Through this area, you can track feedback about chatbot performance graphically. Total and average evaluation rates are displayed instantly with live charts and allow you to easily analyze changes over time. It is a very effective tool for determining user satisfaction trends and identifying which areas of the chatbot need improvement.
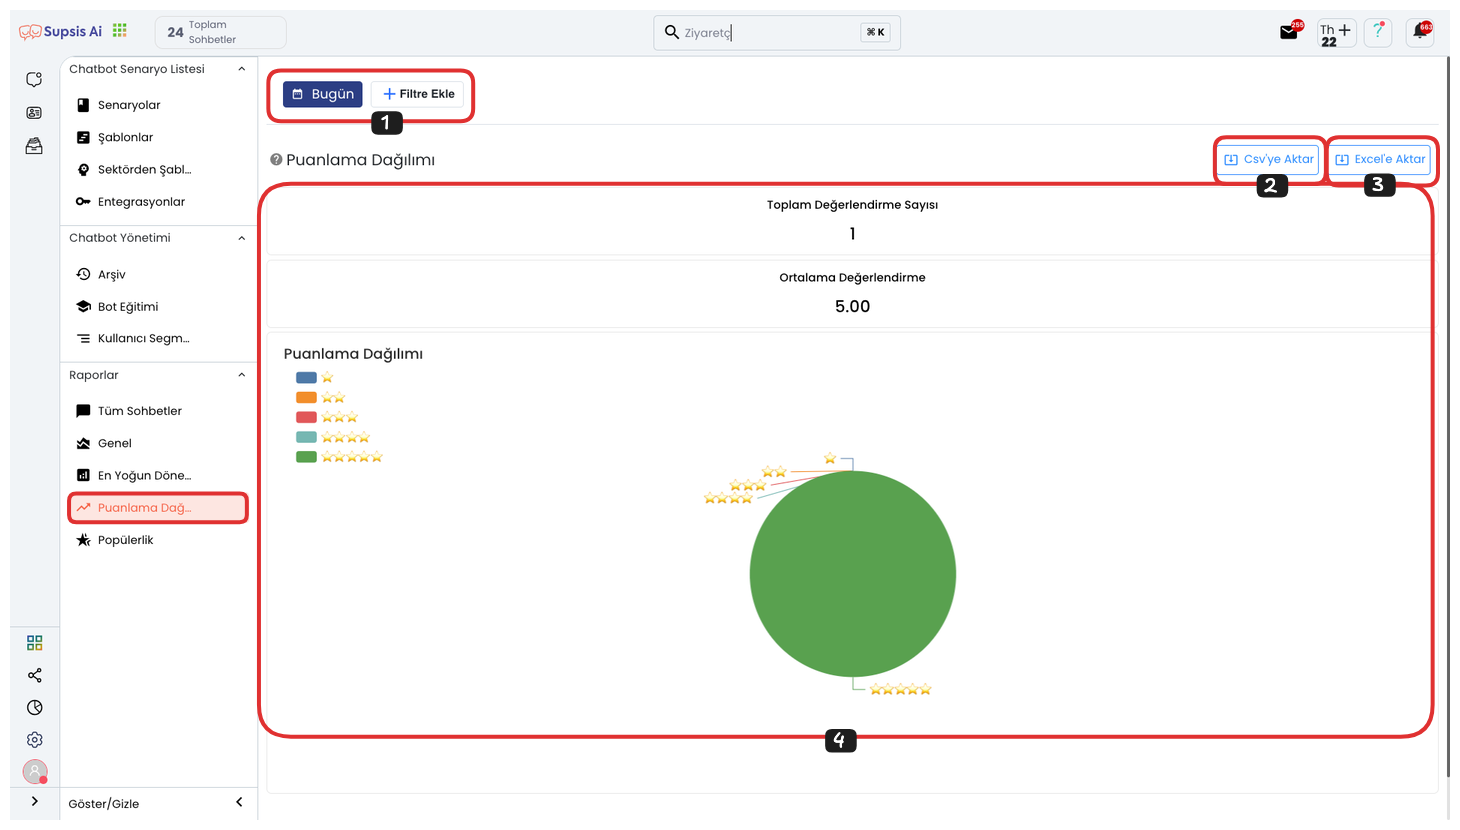
First, you can access the relevant reporting page by clicking on the "Scoring Distribution" option from the main menu located on the left side of the screen. This area presents a visualized analysis of the scores received by Supsis Chatbot after its interactions with users. This section plays a very important role in terms of measuring user experience and evaluating chatbot performance.
When the page opens, you can make the data you are viewing more customized through the filtering panel located in the upper left section of the screen. Through this panel, you can examine historical evaluation data by selecting a specific date range. In addition, you can analyze feedback received only from website or WhatsApp separately by filtering according to the platforms where the chatbot is integrated. You can also isolate and perform detailed comparisons of scores according to different scenarios and setups within the chatbot with story-based filtering.
For all these filtering operations, all you need to do is click the "Add Filter" button and select the filter type you want from the opened menu. After making your selection, the system automatically updates your data and displays only reports that match the selected criteria on the screen. This way, you can make target-oriented analyses without getting lost in the large data pile.
With the export options located in the upper right corner of the screen, you can easily export these filtered reports outside the system. You can download scoring data in the format you want by clicking the "Export to CSV" or "Export to Excel" buttons, share it with your teammates or archive it. This operation is quite functional especially in terms of report presentations or regular performance tracking.
The Scoring Distribution chart located in the middle and lower part of the page visually presents the star scores given by users to the chatbot. On the chart, how many users gave how many points can be easily analyzed. At the same time, the system automatically calculates the general average of the scores received out of 5 and allows you to track it in the visual interface. This way, you can quickly see how the chatbot is evaluated by users and compare satisfaction trends over time.
The Scoring Distribution report not only measures performance; it also reveals which scenarios or integrations receive more successful feedback. This data serves as an important guide for making your chatbot more effective, improving user experience and determining areas that need intervention when necessary.