Chatbot General Reports
General Reports is a feature that holistically analyzes the performance and user interaction of Supsis Chatbot. It provides a comprehensive performance report by evaluating basic metrics such as chatbot response quality, solution rate and user satisfaction. This way, you can see the general efficiency of the system and easily identify areas that need improvement.
Chatbot Reports Elements:
- General Settings
- General Chatbot Session Duration
- General Training
- General Segments
1-) General Settings
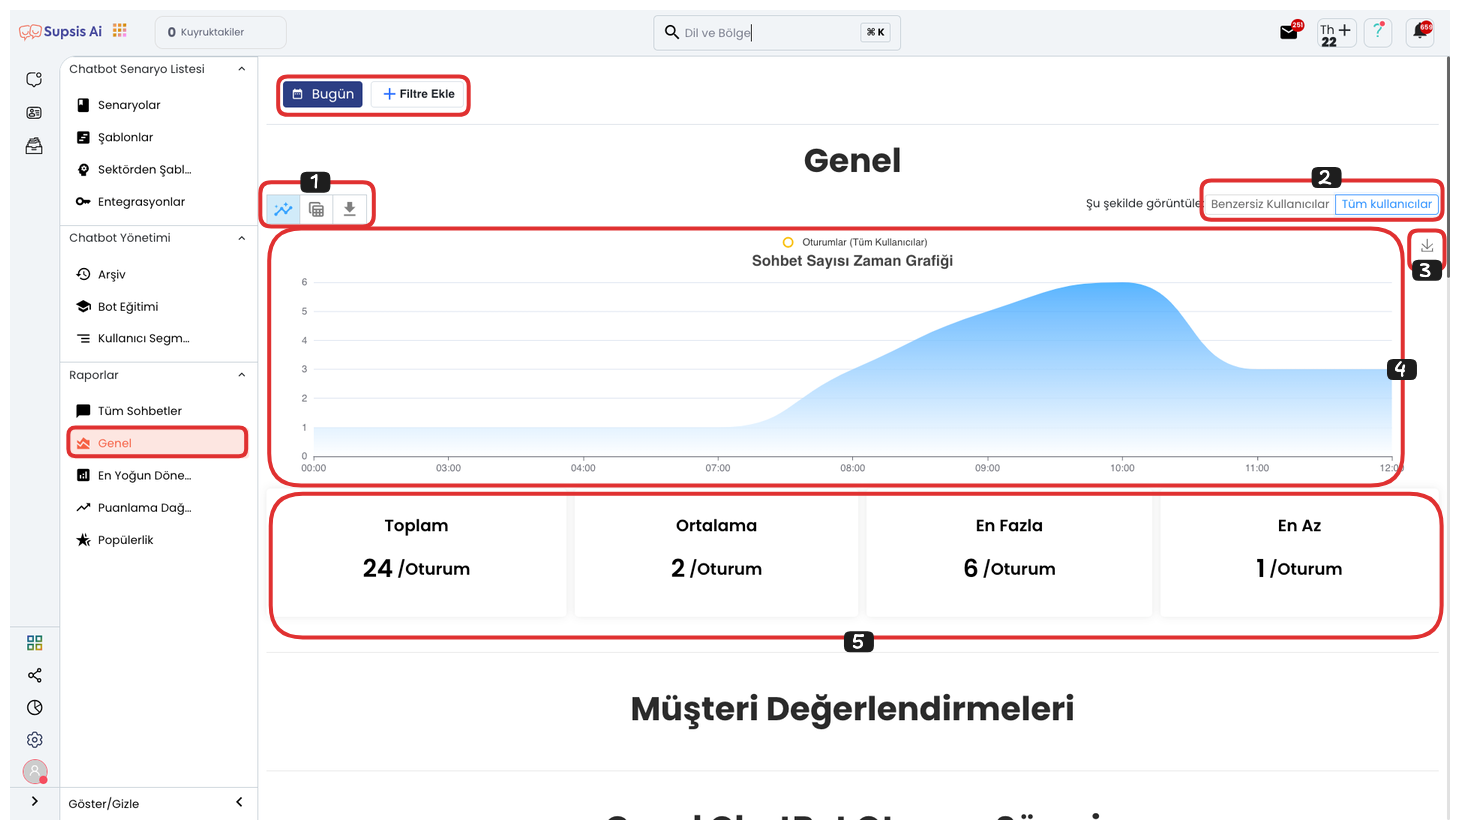
General Settings:
- View and Export
- User Filter
- Save Chart
- Chart
- Reports
1-) View and Export
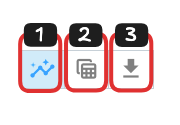
View and Export Elements:
- Chart View
- Table View
-
Download File
-
Chart View: This area allows you to view your report data graphically when you click the button. Chart view makes the data more visual and understandable, facilitating analyses. You can visually track time-based changes, interaction densities and performance trends.
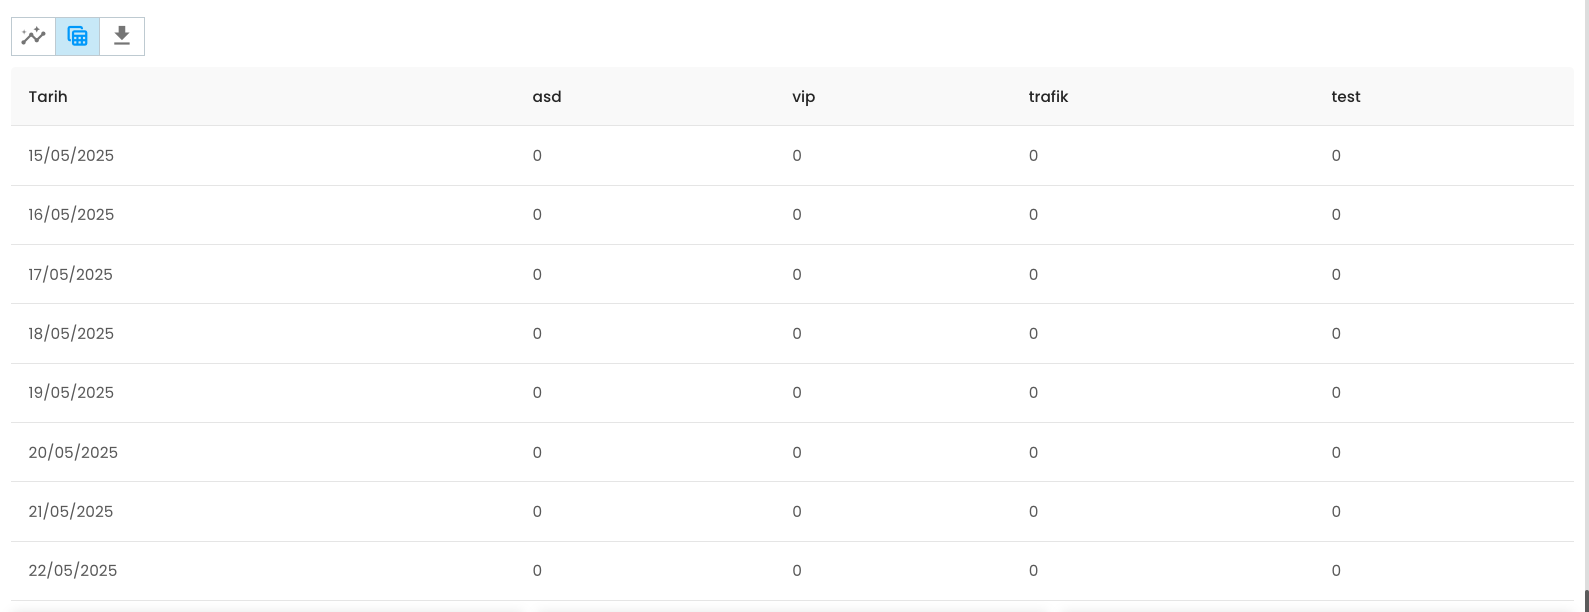
- Table View:
This area allows you to view your report data in table view when you click the button. Tables present data in rows and columns in detail, facilitating comparison and analysis operations. It is ideal for tracking numerical data clearly and regularly. 3. Download File: If you click the "Download File" button from this area, you can download all the data in your report to your computer in Excel format. The data is exported in a regular table structure and can be easily viewed and analyzed in Excel.
2-) User Filter
User Filter allows you to filter report data based on unique users or all users. You can select the filter type you want by clicking one of the two buttons in this area. Unique users exclude repeating users; all users include all interactions.
3-) Save Chart
Save Chart area allows you to download the chart you are viewing as a visual in .png format. This feature provides a practical solution for using chart data in presentations, reports or external sharing.
4-) Chart
Chart area allows you to track report data related to your chatbot in a more organized and visual way. By hovering over specific points on the chart, you can examine detailed data in that time range. This way, you can easily analyze periods when interactions intensify.
5-) Reports
Reports area allows you to view the details of the data presented with the chart numerically. This section contains summary information such as total session count, average values, maximum and minimum sessions. This way, you can reach clear analyses that support chart data.
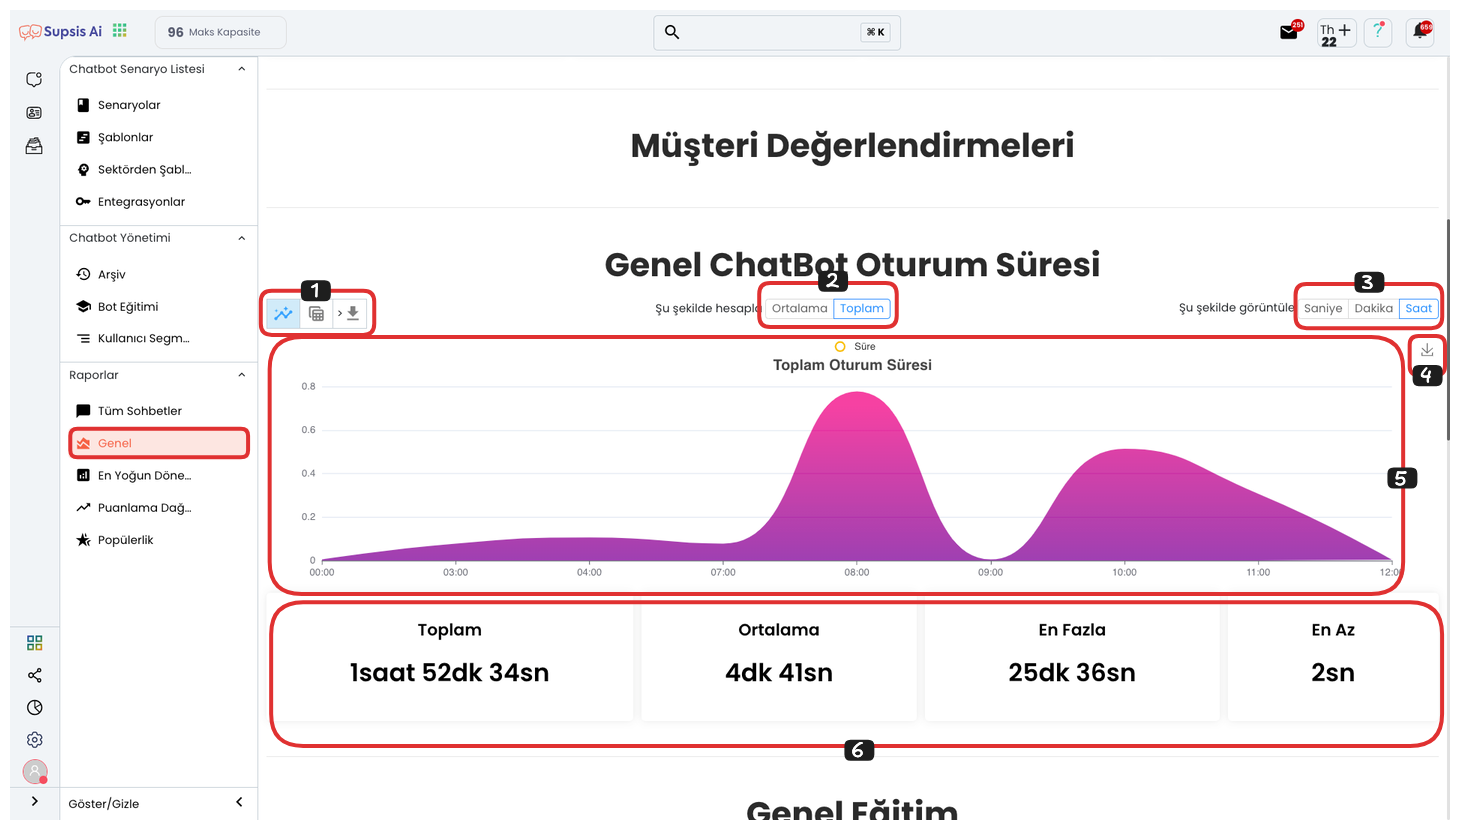
2-) General Chatbot Session Duration
General Chatbot Session Duration:
- View and Export
- Calculation Type
- Display Method
- Save Chart
- Chart
- Reports
1-) View and Export
View and Export Elements:
- Chart View
- Table View
-
Download File
-
Chart View: This area allows you to view your report data graphically when you click the button. Chart view makes the data more visual and understandable, facilitating analyses. You can visually track time-based changes, interaction densities and performance trends.
- Table View:
This area allows you to view your report data in table view when you click the button. Tables present data in rows and columns in detail, facilitating comparison and analysis operations. It is ideal for tracking numerical data clearly and regularly. 3. Download File: If you click the "Download File" button from this area, you can download all the data in your report to your computer in Excel format. The data is exported in a regular table structure and can be easily viewed and analyzed in Excel.
2-) Calculation Type
Calculation Type area allows you to filter your reports according to two different calculation methods: Average or Total. By clicking one of the options in this area, you can ensure that report data is displayed according to the selected calculation type.
3-) Display Method
Display Method area allows you to determine how the data in the chart will be displayed in seconds, minutes or hours. By clicking the time unit you want from the buttons in this area, you can instantly change the measurement type of the chart.
4-) Save Chart
Save Chart area allows you to download the chart you are viewing as a visual in .png format. This feature provides a practical solution for using chart data in presentations, reports or external sharing.
5-) Chart
Chart area allows you to track report data related to your chatbot in a more organized and visual way. By hovering over specific points on the chart, you can examine detailed data in that time range. This way, you can easily analyze periods when interactions intensify.
6-) Reports
Reports area allows you to view the numerical details of the data in the chart more clearly. This section contains information about session durations including Total, Average, Maximum and Minimum. This way, you can easily analyze the temporal distribution of user interactions.
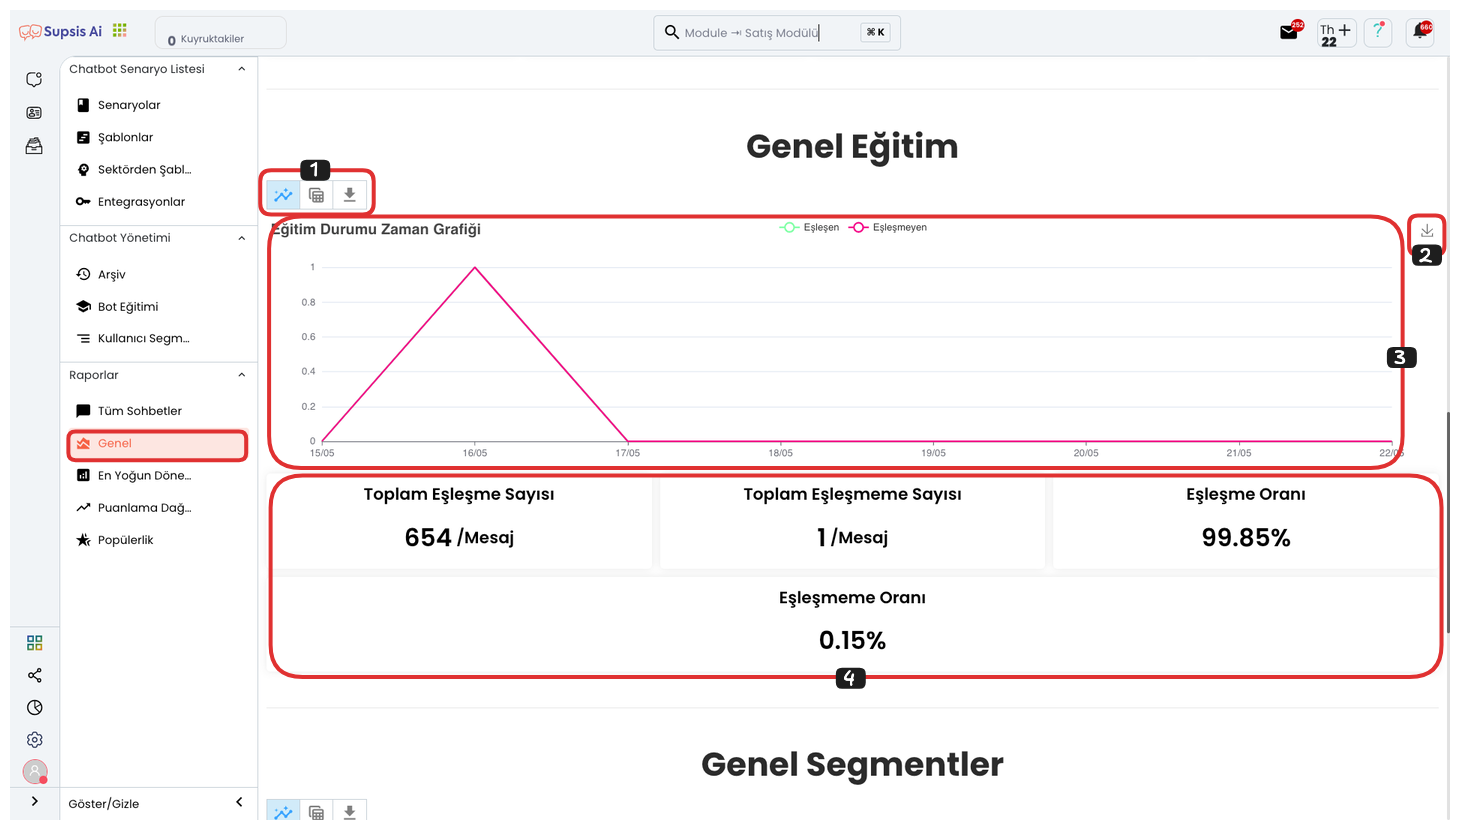
3-) General Training
General Chatbot Session Duration:
- View and Export
- Save Chart
- Chart
- Reports
1-) View and Export
View and Export Elements:
- Chart View
- Table View
-
Download File
-
Chart View: This area allows you to view your report data graphically when you click the button. Chart view makes the data more visual and understandable, facilitating analyses. You can visually track time-based changes, interaction densities and performance trends.
- Table View:
This area allows you to view your report data in table view when you click the button. Tables present data in rows and columns in detail, facilitating comparison and analysis operations. It is ideal for tracking numerical data clearly and regularly. 3. Download File: If you click the "Download File" button from this area, you can download all the data in your report to your computer in Excel format. The data is exported in a regular table structure and can be easily viewed and analyzed in Excel.
2-) Save Chart
Save Chart area allows you to download the chart you are viewing as a visual in .png format. This feature provides a practical solution for using chart data in presentations, reports or external sharing.
3-) Chart
Chart area allows you to track report data related to your chatbot in a more organized and visual way. By hovering over specific points on the chart, you can examine detailed data in that time range. This way, you can easily analyze periods when interactions intensify.
4-) Reports
Reports area allows you to view the details of the data related to the chart in a more understandable way. In this section, you can examine important metrics such as total match count, total mismatch count, match rate and mismatch rate. This way, you can analyze the chatbot's correct response performance more clearly.
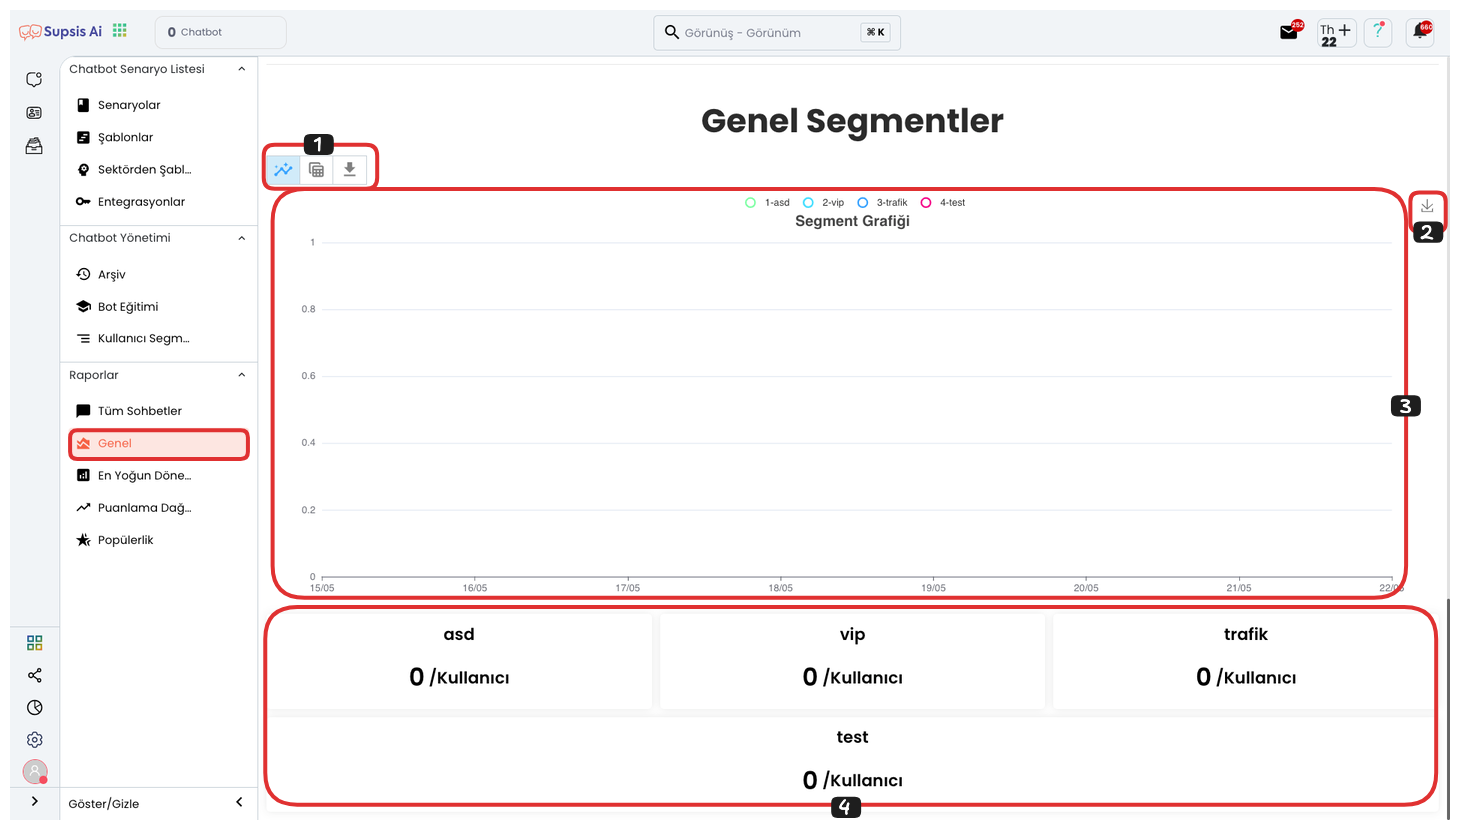
4-) General Segments
General Chatbot Session Duration:
- View and Export
- Save Chart
- Chart
- Reports
1-) View and Export
View and Export Elements:
- Chart View
- Table View
-
Download File
-
Chart View: This area allows you to view your report data graphically when you click the button. Chart view makes the data more visual and understandable, facilitating analyses. You can visually track time-based changes, interaction densities and performance trends.
- Table View:
This area allows you to view your report data in table view when you click the button. Tables present data in rows and columns in detail, facilitating comparison and analysis operations. It is ideal for tracking numerical data clearly and regularly. 3. Download File: If you click the "Download File" button from this area, you can download all the data in your report to your computer in Excel format. The data is exported in a regular table structure and can be easily viewed and analyzed in Excel.
2-) Save Chart
Save Chart area allows you to download the chart you are viewing as a visual in .png format. This feature provides a practical solution for using chart data in presentations, reports or external sharing.
3-) Chart
Chart area allows you to track report data related to your chatbot in a more organized and visual way. By hovering over specific points on the chart, you can examine detailed data in that time range. This way, you can easily analyze periods when interactions intensify.
4-) Reports
Reports area allows you to examine special data related to the chart in detail. In this section, you can view the number of users with tags you have determined and analyze user behaviors through these tags. This way, it becomes possible to do target-oriented reporting.