Chatbot Busiest Period Reports
Busiest Period Reports visually presents the time periods when the chatbot receives the most interactions in the date range you specify, with color toning. Thanks to this area, you can easily detect which days and time intervals experience density, analyze your interaction traffic and shape your operational planning accordingly.
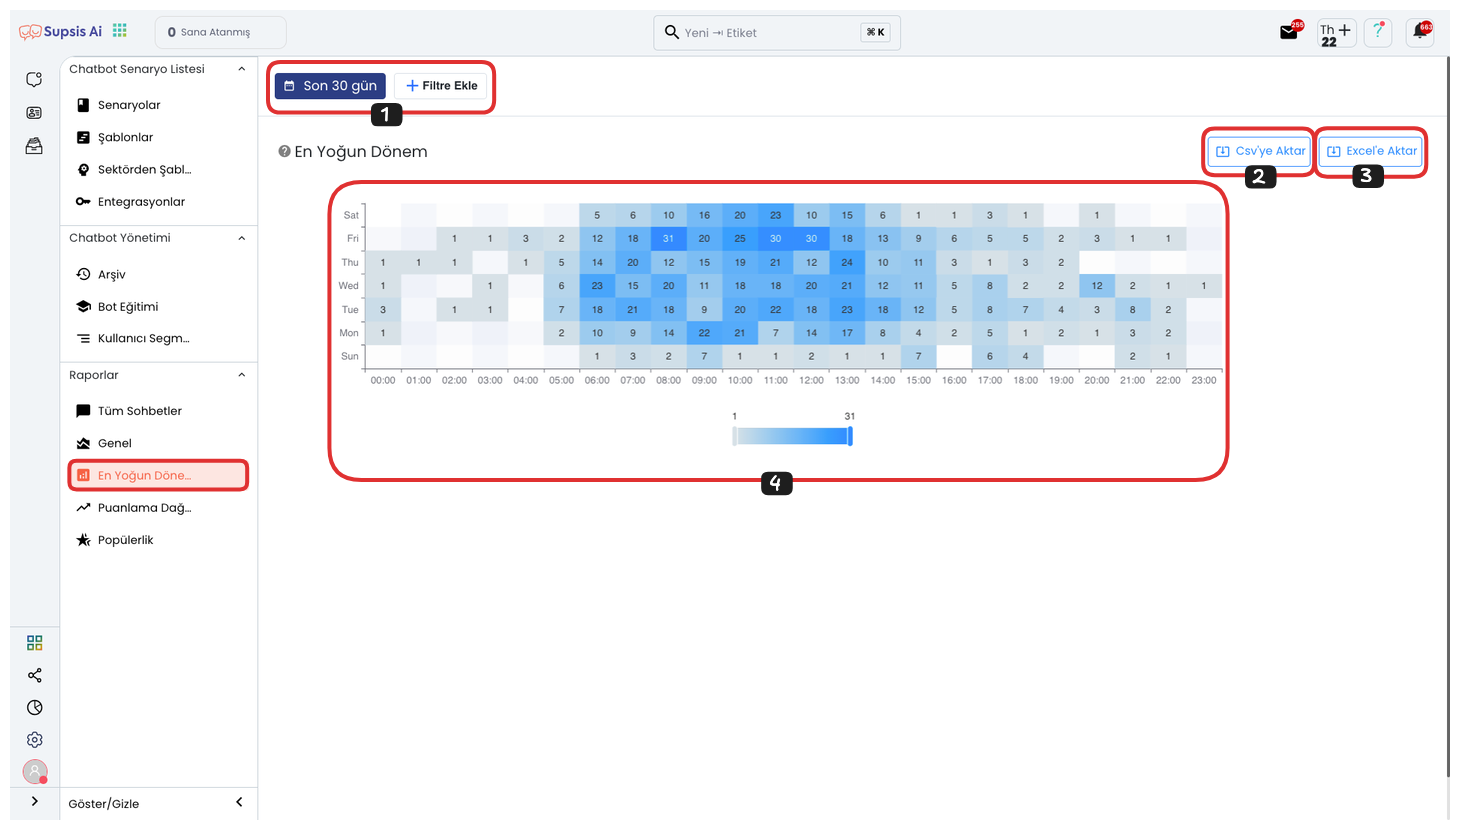
First, you can access the relevant report screen by clicking on the "Busiest Period" option from the main menu located on the left side of the screen. This area allows you to analyze in detail which time periods your Supsis Chatbot is used more intensively. Visually tracking which hours of the day or which days of the week users interact more provides great advantages in terms of resource planning and user experience.
When the page opens, you can customize your report data through the "Add Filter" area located in the upper left section of the screen. This filtering panel offers three main categories: Date, Integration and Story. With the date filter, you can select a specific day, week or month; with the integration filter, you can limit the data according to the platforms where the chatbot is active (such as website, WhatsApp, etc.). The story filter allows you to analyze by isolating chat interactions belonging to a specific scenario.
After making your filters, you can export your reports outside the system with the export options located in the upper right corner of the screen. By using the "Export to CSV" and "Export to Excel" buttons, you can download your selected dataset in the appropriate format to your computer, share it with your teammates or use it for further analysis. This feature saves time especially in presentation and reporting processes.
The large chart area located at the bottom of the page allows you to visually analyze the busiest periods. According to the date ranges you specify, it clearly shows which time periods experience more interactions on the chart using color transitions. The darker the colors, the higher the interaction density in that time period. This way, you can clearly see the busiest usage hours on a daily or weekly basis and shape your chatbot capacity or support team planning accordingly.
Busiest Period Reports not only detect density but also provide critical insights to increase operational efficiency and respond faster to user demands. This area is extremely functional especially in terms of time management in customer services, shift planning and development of automation processes.